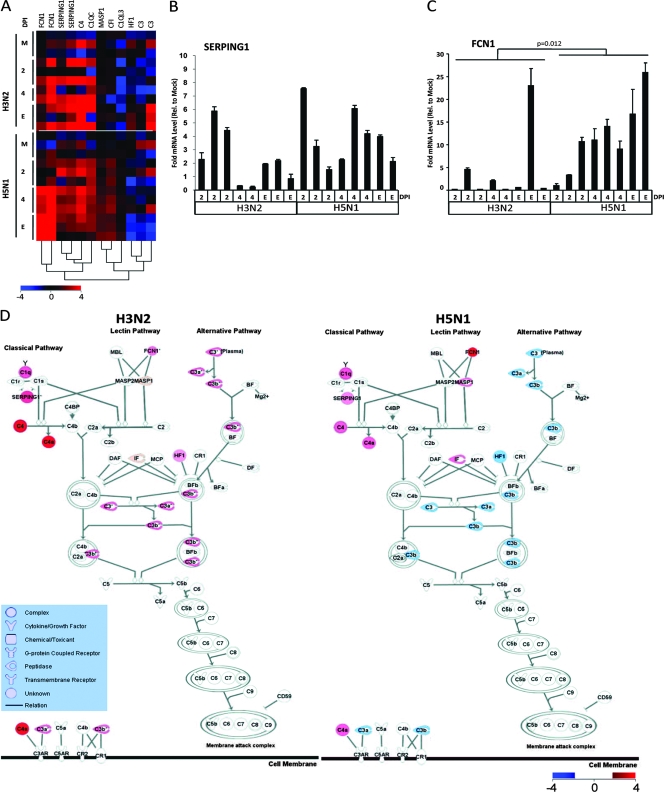
FIG. 2.
Complement cascade activation in the lungs of influenza virus-infected ferrets. (A) One-way hierarchical clustering of complement-related genes selected by IPA from the three innate-immunity-related gene clusters in Fig. 1 (red, upregulated; blue, downregulated). (B) qRT-PCR analysis of SERPING1 gene expression performed in triplicate. Error bars indicate standard deviations. (C) qRT-PCR analysis of FCN1 performed in triplicate. Error bars indicate standard deviations, and the Mann-Whitney P value is shown. (D) IPA canonical pathway modeling of the complement system using the microarray analysis of gene expression data from the lungs of influenza virus-infected ferrets at the end point (red, upregulated; blue, downregulated). M, mock. E, end point as described in Materials and Methods.

