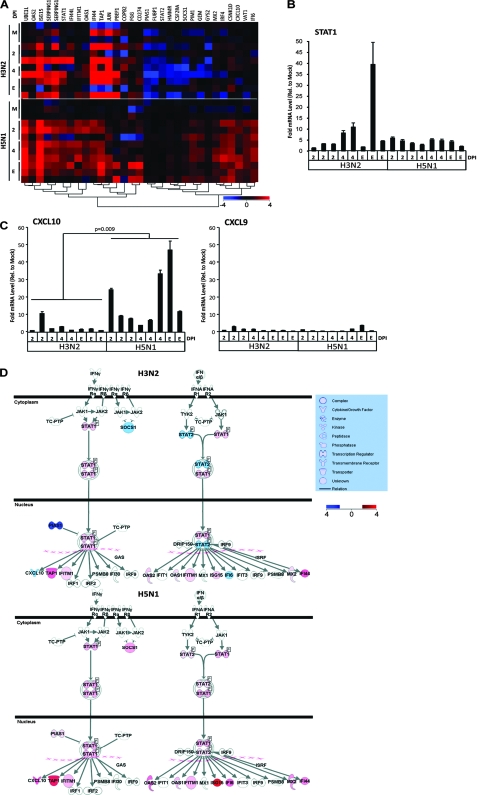
FIG. 3.
IFN signaling pathway activation in the lungs of influenza virus-infected ferrets. (A) One-way hierarchical clustering of IRGs selected by IPA from the three innate immunity-related gene clusters in Fig. 1 (red, upregulated; blue, downregulated). (B) qRT-PCR analysis of STAT1 performed in triplicate. Error bars indicate standard deviations. (C) Left, qRT-PCR analysis of CXCL10. The Mann-Whitney P value is shown. Right, qRT-PCR analysis of CXCL9. Analyses were performed in triplicate, and error bars indicate standard deviations. (D) IPA modeling of the IFN signaling pathway using the microarray analysis of gene expression data from the lungs of influenza virus-infected ferrets at the end point (red, upregulated; blue, downregulated). M, mock. E, end point as described in Materials and Methods.

