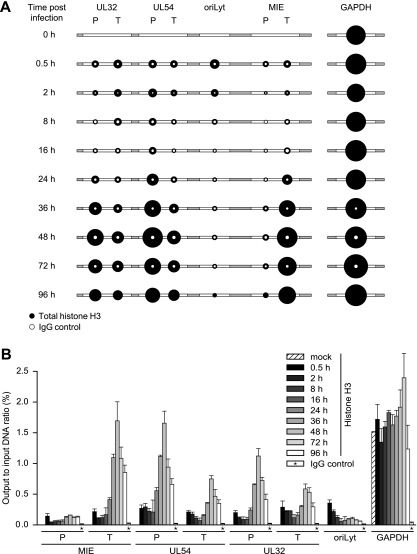
FIG. 4.
Temporal patterns of histone H3 occupancy in selected regions of the CMV genome. MRC-5 cells were infected with CMV, and cell extracts were subjected to ChIP using an antibody specifically directed against the C-terminal domain of H3 at the indicated times (0.5 to 96 h) postinfection. Normal rabbit IgG was used to control for nonspecific precipitation. Quantitative PCR was performed on input and coprecipitated (output) DNAs with primers specific for the indicated viral genomic regions and human GAPDH. (A) The circular areas represent the mean output-to-input DNA ratios determined from at least two independent ChIP assays, each quantified in duplicate. Where white circles are missing, no specific PCR products were detected. (B) The data set used for the schematic representation in panel A is shown as bars (mean values) with standard deviations. For the IgG controls, average values from all 10 time points are shown.

