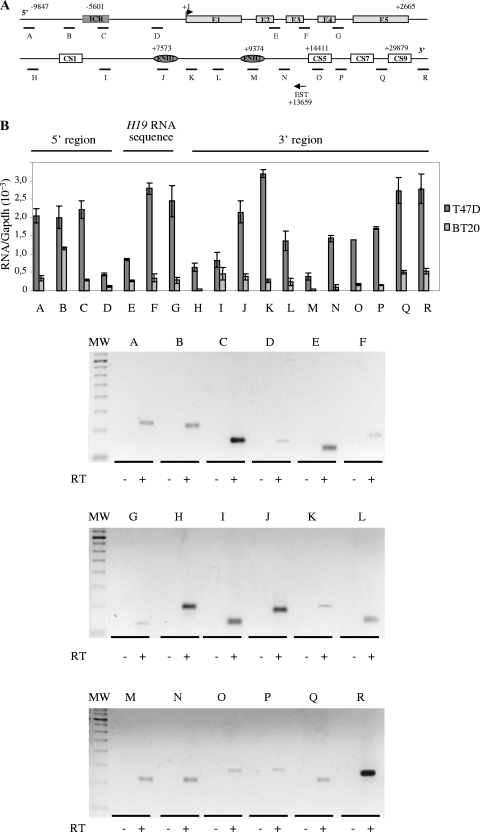
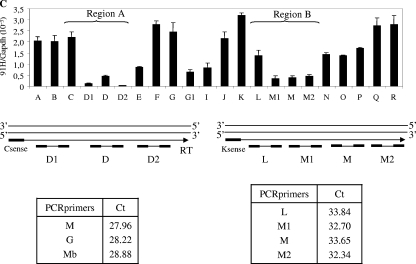
FIG. 1.
Detection of an intergenic transcriptional activity at the H19 locus in cancer cell lines. (A) Map of the H19 gene locus. The relative positions of the real-time PCR amplification fragments (A to R) are depicted in the map. CS represents conserved regions between mice and humans that possess enhancer activities (17). Black arrow represents a known EST that was identified after alignment of the human chromosome 11 sequence with EST databases. EST, BX 377296 cDNA source placenta. (B) Quantification of RNA levels were determined by real-time RT-PCR on total RNA samples in T47D and BT20 cell lines. The results were normalized to GAPDH expression levels. Agarose gel shows the amplification products obtained after the real-time PCR on T47D cells. Note that amplifications E to G may also potentially quantify H19 precursors RNAs. (C) Strand-specific RT in two regions showing a decrease of 91H transcription (region 1 and region 2). Antisense-specific RT analyses were performed with the primer C sense in region 1 and K sense in region 2. Transcription was detected by PCR using several contiguous primer pairs (D1, D, and D2 for region 1 and L, M1, M, and M2 for region 2). Results, expressed in terms of the cycle threshold (Ct) are indicated in the lower part of panel C. Cycle threshold values that are equivalent for all primer pairs indicate that there is no transcriptional arrest in both tested regions. Primer sequences are available in Table S1 in the supplemental material.


