FIG. 3.
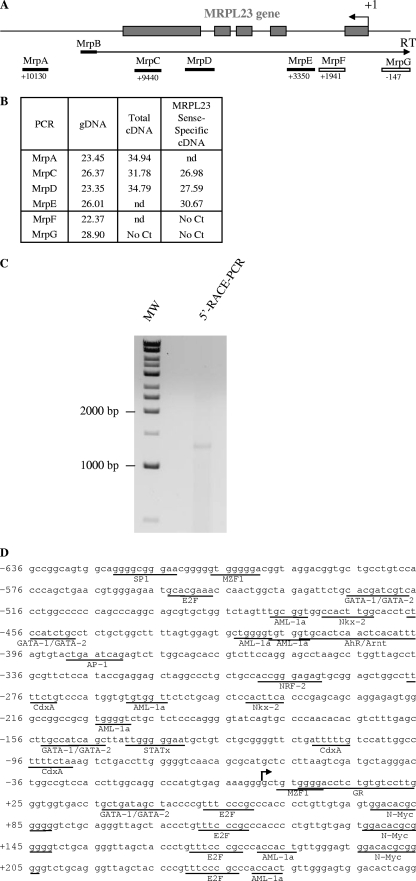
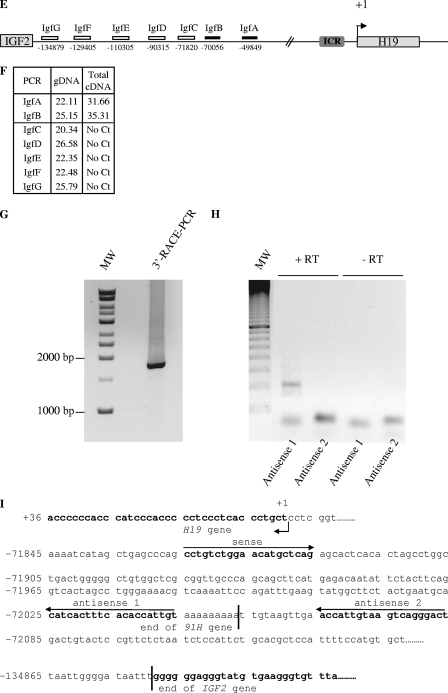
Determination of the 5′ and 3′ limits of the antisense H19 transcription. (A) Map of the MRPL23 gene region. The relative positions of the PCR amplifications and strand-specific primer used for reverse transcription (MrpB) are indicated. (B) Table indicates cycle thresholds obtained in real-time PCR for each PCR amplifications on total cDNA (random priming of the RT) or after strand-specific reverse transcription with MrpB primer. gDNA is used as a positive amplification control to assess for the amplification efficiency. (C) Determination of the transcription start site of the 91H gene by 5′RACE-PCR. RACE-PCR using T47D cell cDNA and 91H specific primers resulted in the amplification of an ∼1,300-bp DNA fragment. This fragment was cloned into TOPO plasmid for sequencing. (D) Nucleotide sequence of the 5′ region of the 91H transcript. The transcription start site is indicated by a black arrow. Putative transcription factor binding sites identified by computer analysis are underlined. (E) Map of the H19/IGF2 locus. Boxes indicate PCR amplifications used to determine the 3′ limits of the antisense transcription. Successful amplifications are depicted by full boxes, whereas abortive amplifications are shown as open boxes. (F) A table indicates the cycle thresholds (Ct) obtained for each PCR amplification. (G) Determination of the 3′ end of the 91H RNA by 3′RACE-PCR. RACE-PCR using T47D cell cDNA resulted in the amplification of an ∼1,750 bp-DNA fragment. This fragment was cloned into the TOPO plasmid for sequencing. (H) Confirmation of the 3′ end of 91H. RT-PCRs were performed with the primer pairs depicted in panel I: sense plus antisense 1 or sense plus antisense 2. (I) Nucleotide sequence of the 3′ region of the 91H transcript. The H19 and IGF2 genes are indicated in boldface, and the 3′ limit of 91H is pointed out by a black line. Positions relative to the H19 transcription start site (+1) are indicated. Primer sequences can be seen in Table S1 in the supplemental material.


