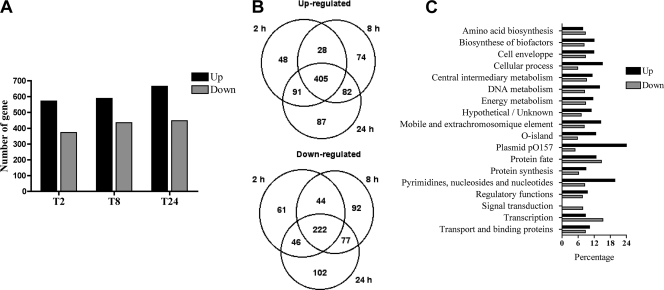
FIG. 2.
Global analysis of differentially expressed genes. (A) Number of upregulated or downregulated genes at each intracellular time point of macrophage infection. (B) Venn diagram of the number of up- or downregulated genes at each intracellular time point. (C) Distribution of E. coli genes in functional categories (COG). Percentages of upregulated and downregulated genes for each functional class at 24 h postinfection are shown. Data are the means from four replicates.

