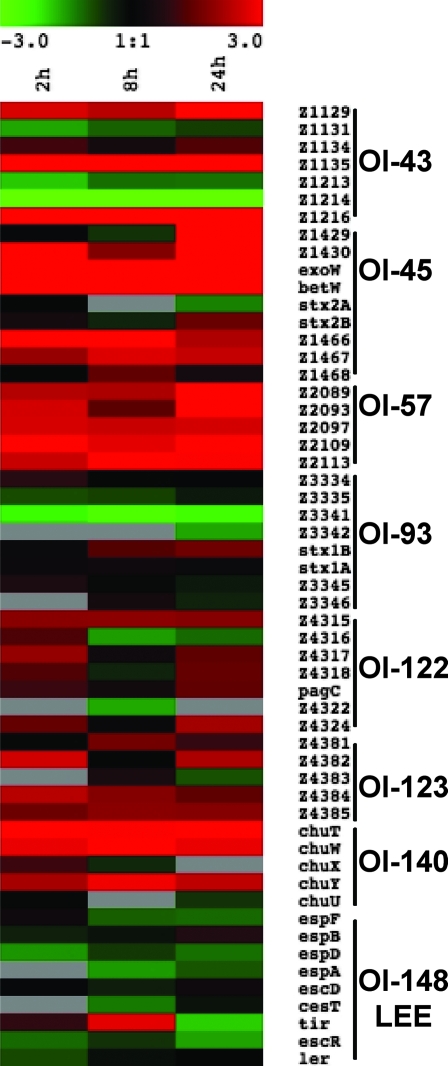
FIG. 5.
Heat map of expression levels of predicted open reading frame selected from specific OI over time during macrophage infection. Expression values were determined from the ANOVA and are represented colorimetrically, with red representing upregulation (ratio of 3) and green representing downregulation (ratio of −3) on a log2 scale. Data are the means from four technical replicates.

