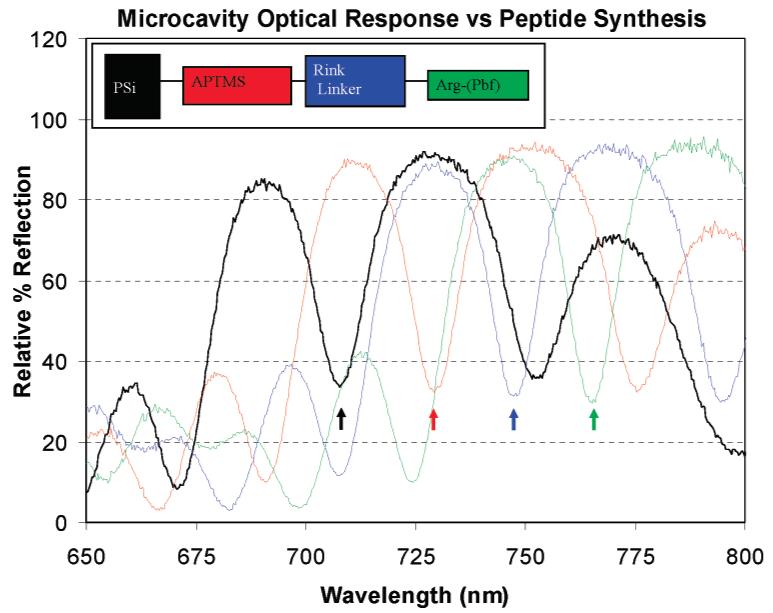
Figure 2.

White-light reflection spectrum illustrating optical red shifts relative to the baseline (black) following each sequence of synthetic coupling and Fmoc-deprotection steps: APTMS (red), Rink linker (blue), and Arg-(Pfb) (green). The PSi sensor/scaffold was washed and dried prior to recording optical measurements. Optical shifts result from changes in local RI caused by surface modifications that decrease porosity. The scaffold/sensor is dried before measurements to eliminate bulk RI change due to solvent in the PSi matrix.
