
Figure 4.
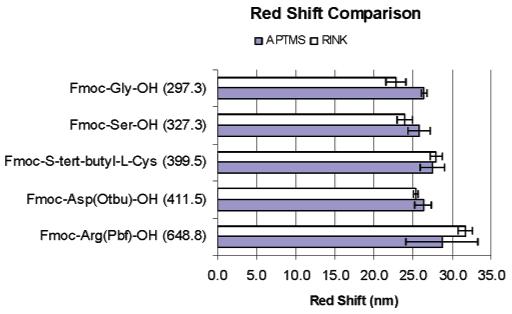
Bar chart contrasting the magnitude of the red shift for the corresponding amino acid coupled onto the amino-terminated APTMS-PSi surface and the acid-labile Rink linker. The amino acid molecular weight is indicated in parentheses. The data suggests comparable coupling efficiencies.