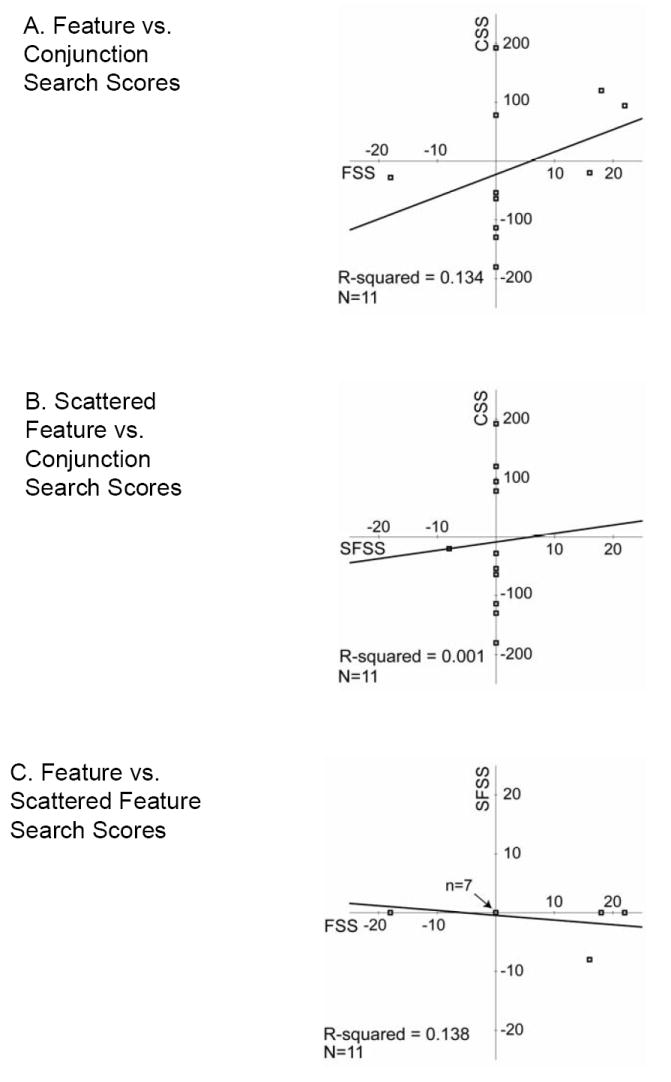
Figure 5.

Scatter plots of healthy performance on the adaptive tasks: (A) Feature versus Conjunction Search, (B) Scattered Feature versus Conjunction Search and (C) Feature versus Scattered Feature. Regression lines and R2-values are shown for each pair of measures. Negative scores indicate that left target detection required longer presentation times than right target detection; conversely, positive scores indicate that right target detection required longer presentation times than left target detection. Scores of 0 indicate no field differences in target detection. Note that the scales vary: for CS it spans +/- 250, and for FS and SFS it spans +/- 25. In plot C, 7 points overlap (with scores of 0 on both measures).
