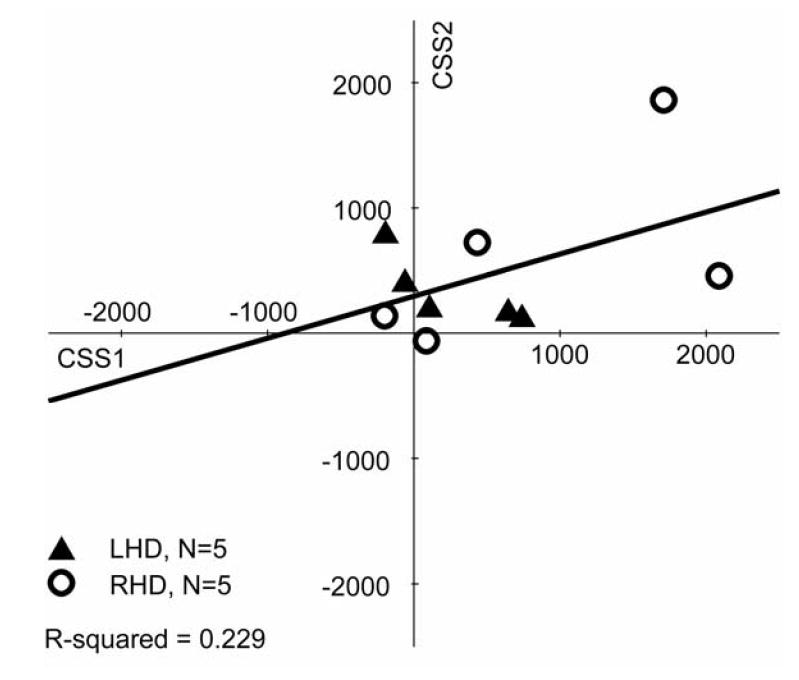
Figure 9.

Scatter plots of patient performance on the Conjunction Search task at two different delays post-stroke (on average, with ~1 year delay). Positive values indicate contralesional scores (i.e., hemispatial neglect), whereas negative values indicate ipsilesional scores. No differences between contralesional and ipsilesional target detection result in 0 scores. The regression line and R2-value is shown. Patient lesion side is indicated by filled triangles for LHD and open circles for RHD.
