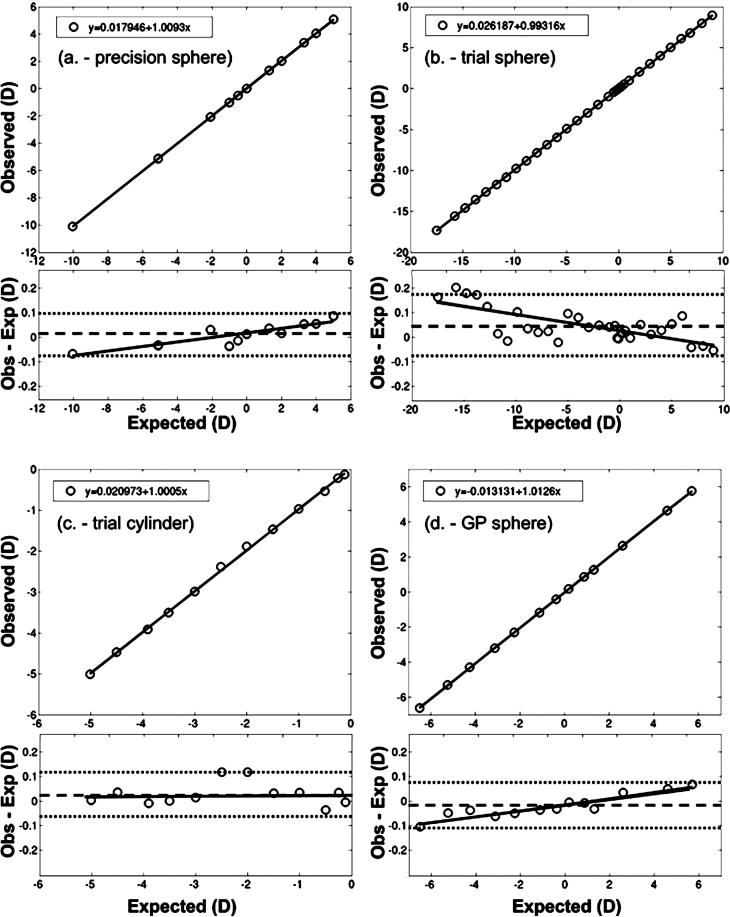
FIGURE 3.
The observed (instrument measured) vs. the expected in-air power of a series of (a) precision calibration spheres, (b) spherical trial sphere lenses, (c) trial cylinder lenses, and (d) 7.5 mm base curve radius RGP contact lenses. Accompanying each observed vs. expected plot are the corresponding Bland-Altman plots. Within these plots, the individual difference in observed and expected sphere values (symbols) are plotted against the expected sphere power, along with the mean difference (dashed line), the 95% CI of the difference (LoA) (dotted lines), and the best-fit regression (solid line).

