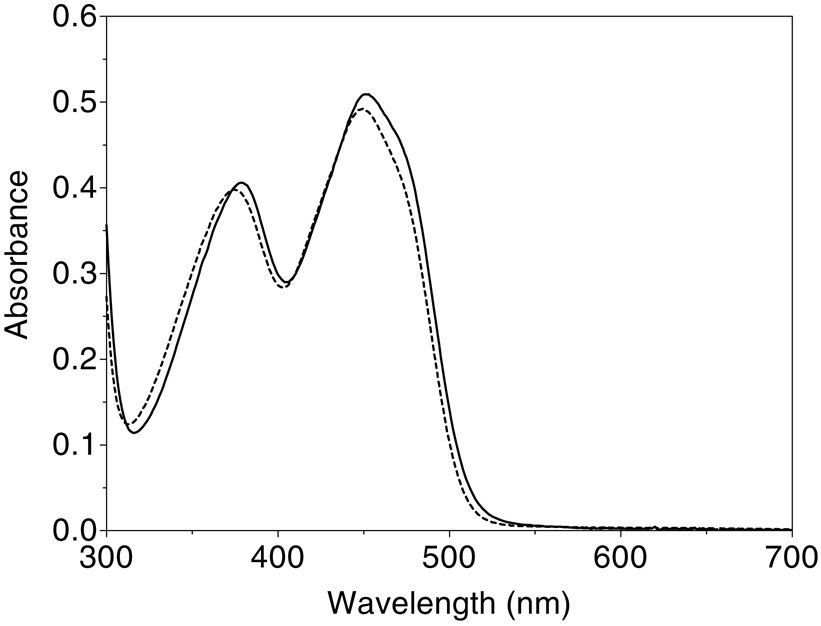
Figure 3.
Visible spectrum of Erv2p before and after denaturation. The visible spectrum of Erv2p, incubated with free FAD before gel filtration, was recorded in 50 mM Tris, pH 7.5, before (solid line) and after the addition of 0.5 mM CTAB (dashed line; see Methods).

