
Figure 10.
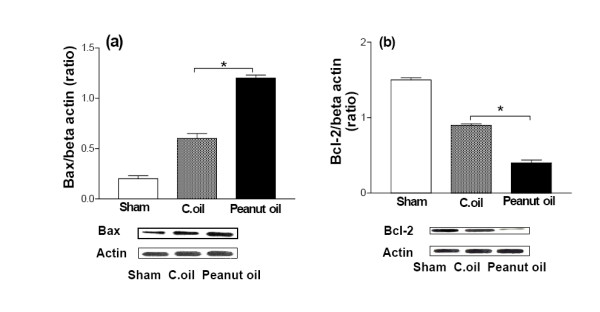
Effect of C.oil on Western blot analysis of Bax and Bcl-2expression after 24 hrs of ischemia in the brain.(a) Bax expression by immunoblotting. Bar chart shows the quantification of bands. Lower Panel showing the representative bands for Bax and β-Actin as lane 1: sham-operated, lane 2: Peanut oil treated ischemic, and lane 3: C.oil post treated (50 μg/lane). Ischemia induced Bax expression was greatly reduced by C.oil post treatment. Data are expressed as mean ± S.E.M of five animals per group. *P < 0.05 was considered highly significant when comparisons were made with the peanut oil treated ischemic group by one way ANOVA followed by Newman Keuls post hoc test. (b) Bcl-2 expression by immunoblotting. Bar chart shows the quantification of bands. Lower Panel showing the representative bands for Bcl-2 and β-Actin as lane 1: sham-operated-operated, lane 2: Peanut oil treated ischemic, and lane 3: C.oil post treated (50 μg/lane). Ischemia induced Bcl-2 expression was greatly increased by C.oil post treatment. Data are expressed as mean ± S.E.M of five animals per group. (*P < 0.05) was considered highly significant when comparisons were made with the peanut oil treated ischemic group by one way ANOVA followed by Newman Keuls post hoc test.