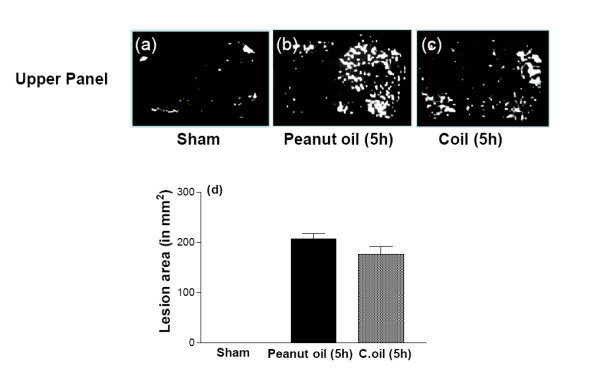
Figure 2.

Effect of C.oil post-treatment on lesion area of brain at 5 hrs. The MRI scan was taken from same rat, before, after ischemia and 1 hr after peanut oil treatment- the ischemic group. In the second set of rats MRI scan was taken before and after ischemia and again after 1 hr of C.oil treatment. Hyper intense areas represent the lesion. Upper panel shows the representative photograph of brain scan from brains of sham-operated (a), 5 hrs after rat treated with peanut oil (b) and 5 hrs after rat treated with C.oil (c). Bar graph (d): The bar chart showing the lesion area of brains of sham-operated, peanut oil treated ischemic and C.oil post-treatment ischemic group at 5 hrs. Data are expressed as mean ± S.E.M. P < 0.001 was considered highly significant when comparisons were made with the peanut oil treated ischemic group by one way ANOVA followed by Newman Keuls post hoc test. Data are from five rats per group.
