Figure 6.

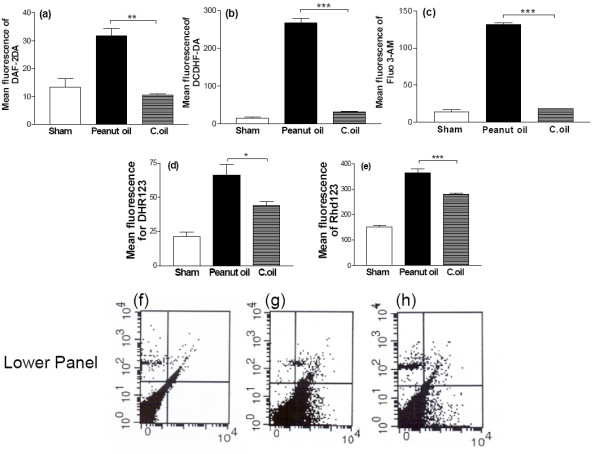
Flowcytometric estimation of neuronal rich cell population from sham-operated, peanut oil treated ischemic and C.oil treated groups were euthanized at 24 hrs. Brain neuronal rich cell population were loaded with different fluorochromes for the estimation of neuronal Reactive Oxygen Species (ROS), Nitric oxide (NO), Peroxynitrite (ONOO-), mitochondrial membrane potential (ΔΨm), intracellular calcium level and quantification of cell death type. Mean fluorescence of neurons (106/ml) were acquired for quantification and analyzing in cell quest program of Becton Dickinson Flowcytometer. Data are expressed as mean fluorescence ± S.E.M P < 0.001 was considered highly significant when comparisons were made with the peanut oil treated ischemic group by one way ANOVA followed by Newman Keuls post hoc test. Five rats per group were used. (a): Nitric oxide from neurons (106/ml) were estimated using Diaminofluoresceindiacetate (DAF-2DA). (b): ROS were estimated from neurons (106/ml) using the mean fluorescence of DCDHF-DA. (c): Measurements of intracellular calcium from neurons (106/ml) were estimated using, fluorescence of Fluo-3AM. (d): Peroxynitrite was estimated from neurons (106/ml) using the mean fluorescence of DHR 123. (e): For estimation of mitochondrial membrane potential the mean fluorescence of Rhod 123 obtained from neurons (106/ml). Lower panel: Representative dot plots for quantification of mode of death, the mean florescence, from neuron using FITC- conjugated Annexin V and Propidium iodide (PI). Neurons (106/ml) were obtained from sham-operated (f), peanut oil treated ischemic (g) and C.oil post-treatment ischemic (h) groups of rats; lower left quadrant shows viable cells (Annexin V negative and PI negative), lower right quadrant shows early apoptosis (Annexin V positive and PI negative, Upper right quadrant shows late apoptotic/necrotic cells (Annexin V positive and PI positive) and upper left quadrant shows necrotic cells (Annexin V negative and PI positive).
