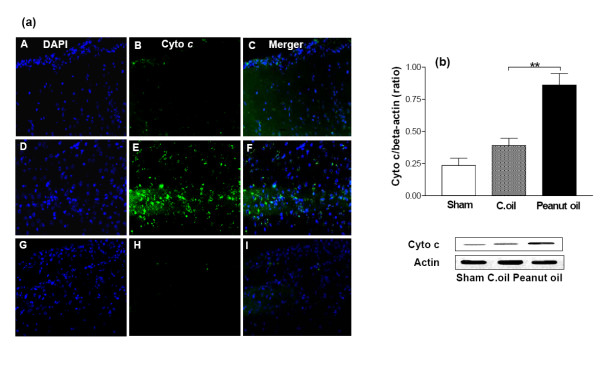
Figure 9.
Effect of C.oil on immunohistochemical and Western blot analysis cytochrome c expression after 24 hrs of ischemia in the brain. (a): Cytochrome c immunoreactivity after 24 hrs of ischemia. Photomicrographs (representative of 5 photomicrographs) showing inducible nitric oxide synthase (iNOS) immunoreactivity in sham-operated group (A-C); peanut oil treated ischemic group (D-F) and C.oil post-treated groups (G-I) after 24 hrs of clot implant. Sections were immunolabeled with a polyclonal anti-cytochrome c antibody, which was observed as green fluorescence (B, E & H) and counterstaining by DAPI is shown as blue fluorescence (A, D & G). The merger is shown in C, F & I. Magnification: 40×. (b) Cytochrome c expression by immunoblotting. Bar chart shows the quantification of bands. Lower Panel showing the representative bands for cytochrome c and β-Actin as lane 1: sham-operated, lane 2: Peanut oil treated ischemic, and lane 3: C.oil post treated (50 μg/lane). Ischemia induced cytochrome c expression was greatly reduced by C.oil post treatment. Data are expressed as mean ± S.E.M of five animals per group. (*P < 0.01) was considered highly significant when comparisons were made with the peanut oil treated ischemic group by one way ANOVA followed by Newman Keuls post hoc test.

