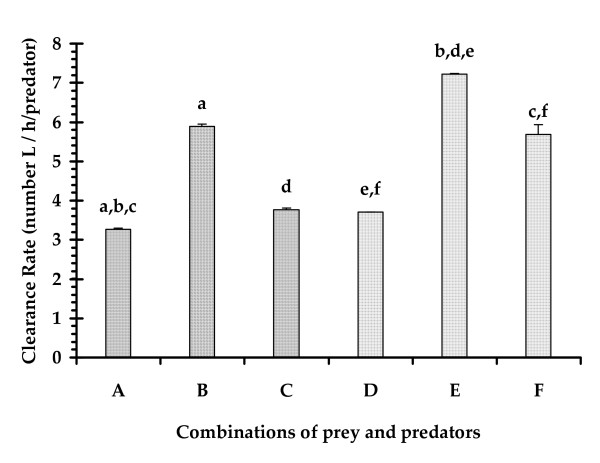
Figure 3.
The clearance rate of the larvae of A. sulcatus under different combinations (A – F) of prey, predator and water volume (n = 9 trials/combinations). The letters shared by the bars represents significant differences between the combinations at P < 0.01, revealed through post hoc Tukey test.

