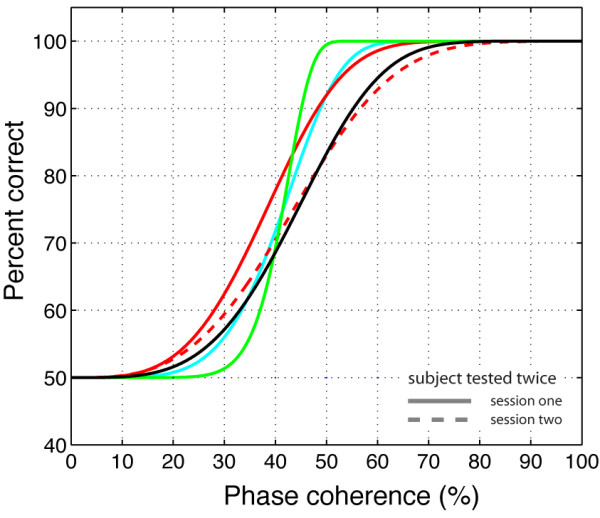
Figure 14.

Percent correct for individual subjects in Experiment 3. The black lines show data from subject RXL. The other colours depict data from all other observers and sessions. Continuous lines indicate the first recording session, while dashed lines indicate the second recording session.
