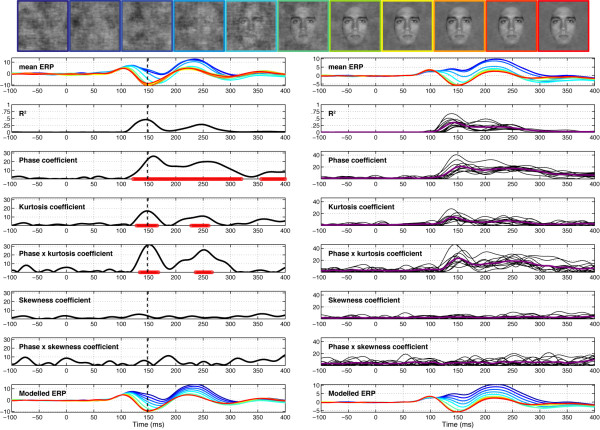
Figure 4.
Session 1 of subject RXL (left) and data averaged across subjects (right) in Experiment 1. The vertical line in the left column indicates the latency of maximum R2 for the model, recorded at electrode E107 for RXL, an electrode halfway between T5 and O1. Electrode E107 is at the centre of the left red cluster in the topographic map of explained variance in Figure 5. At the top, the row of face stimuli shows the colour code used in the mean ERP and modelled ERP plots, from blue (0% phase coherence) to red (100% phase coherence). The time course of the coefficient for the different model parameters is depicted in black, with the horizontal red line showing periods of statistically significant fitting (p < .01, not corrected for multiple comparisons). In the right column, purple lines show the mean coefficient across subjects and the thin black lines data from individual subjects. The beta coefficients are expressed in terms of signal change in μV per unit of the predictor variable.

