Figure 7.

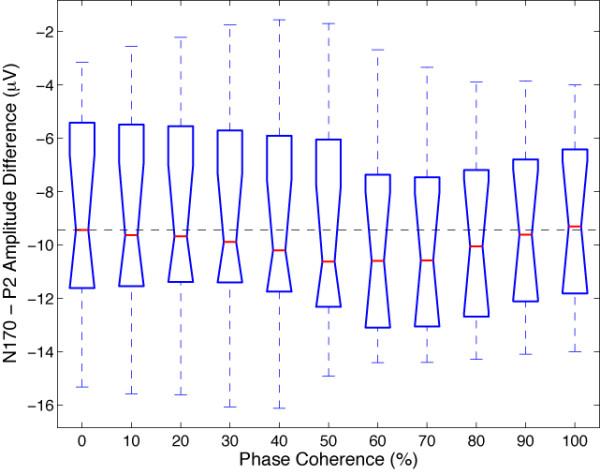
Boxplot of the peak-to-peak differences between the N170 and the P2 measured on modelled data at different levels of stimulus phase coherence for all subjects and sessions in Experiment 1.

Boxplot of the peak-to-peak differences between the N170 and the P2 measured on modelled data at different levels of stimulus phase coherence for all subjects and sessions in Experiment 1.