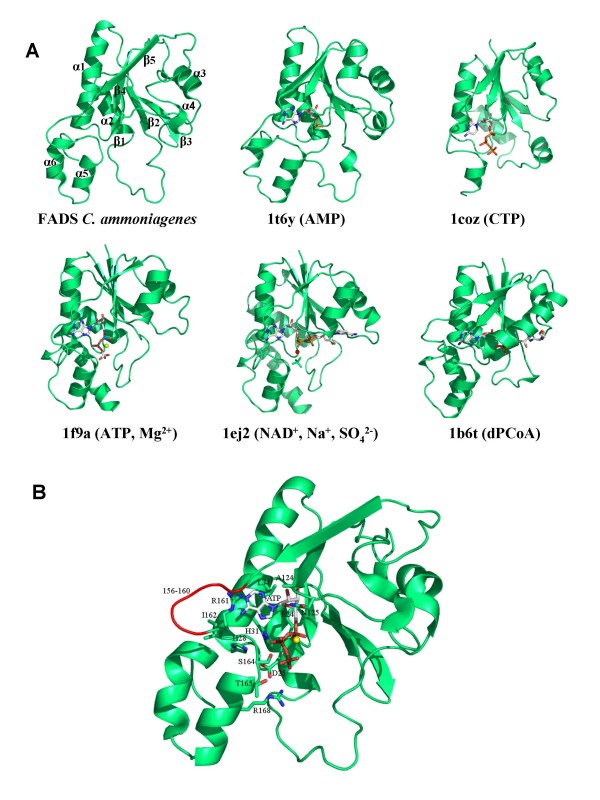
Figure 5.
N-terminal domain structure of CaFADS. (A) Comparison of the structural elements with those found in NTs. (B) Model for the interaction of ATP-Mg2+ with the N-terminal domain. Residues putatively involved in the NT activity and ATP binding are drawn as sticks and CPK coloured. Carbon atoms are shown in green and white, for the protein side-chains and nucleotides, respectively. Mg2+ and Na+ ions are shown as yellow and red balls, respectively.

