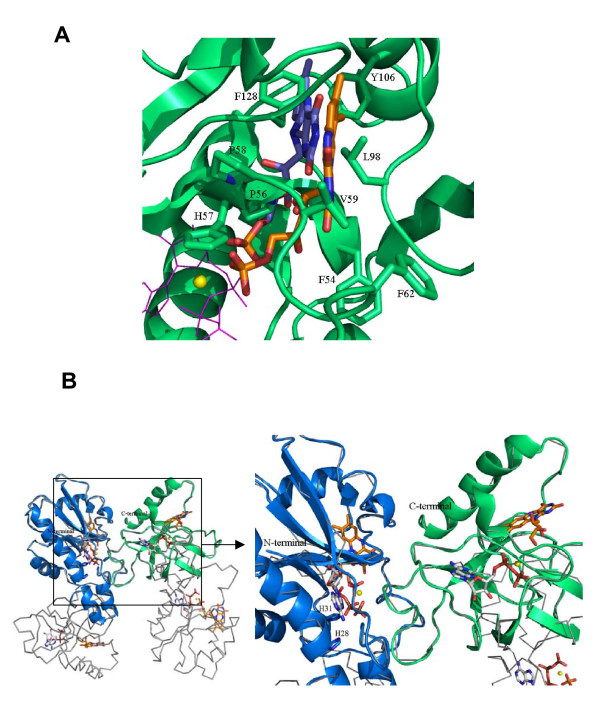
Figure 6.
Localisation of the flavin binding site at the N-terminal domain of CaFADS. (A) Models for the interaction of FMN with the N-terminal domain. FMN and residues putatively involved in its stabilisation are drawn in sticks and CPK coloured. Two possible conformations for the FMN are indicated (Carbon atoms are in orange and blue, respectively). Positions of ATP and Mg2+ are also indicated as pink lines and a yellow ball, respectively. (B) Model for the interaction between two CaFADS monomers (grey lines), based on the TmFADS crystallographic dimeric crystal unit. The C-terminal of monomer 1 is shown in green and the N-terminal of monomer 2 in blue. Position of the RF and FMN substrates, as well as ATP-Mg2+, are indicated at each binding site in CPK. Carbon atoms are shown in white and orange for nucleotides and flavins, respectively. H28 and H31 are shown as sticks.

