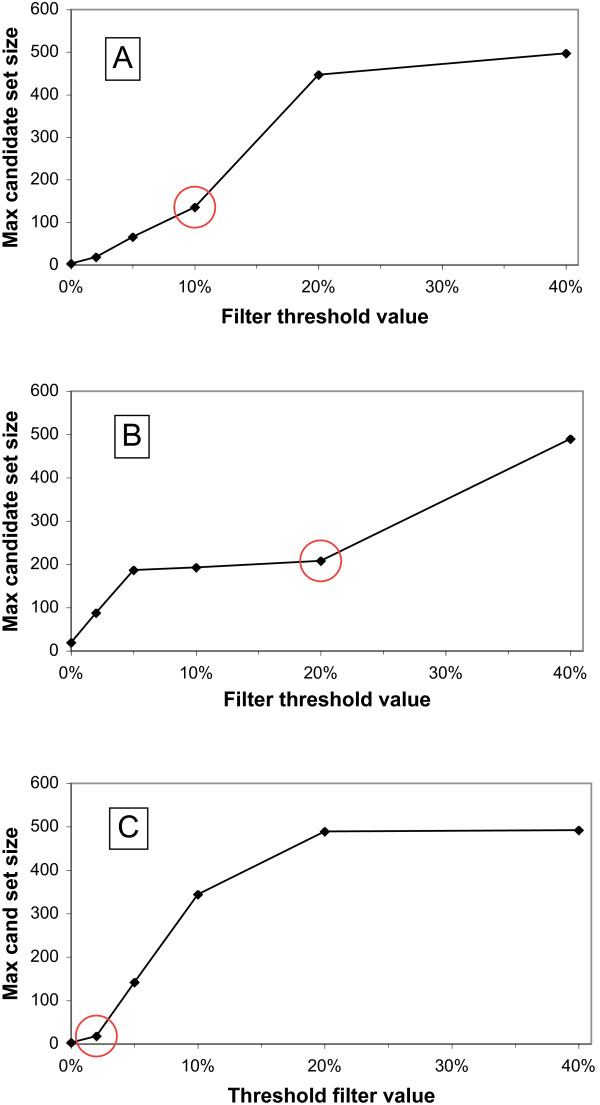
Figure 1.
Threshold filter determination patterns at genus level granularity for organisms whose phylogenetic relatives are represented at different abundances in Genbank nr. The circled point in each panel was chosen as the DarkHorse threshold filter value, a heuristic for calculating bitscore window sizes in that genome. Panel A, typical phylogenetic representation example, Salinispora tropica. Panel B, high representation example, Escherichia coli HS. Panel C, low representation example, Borrelia burgdorferi.

