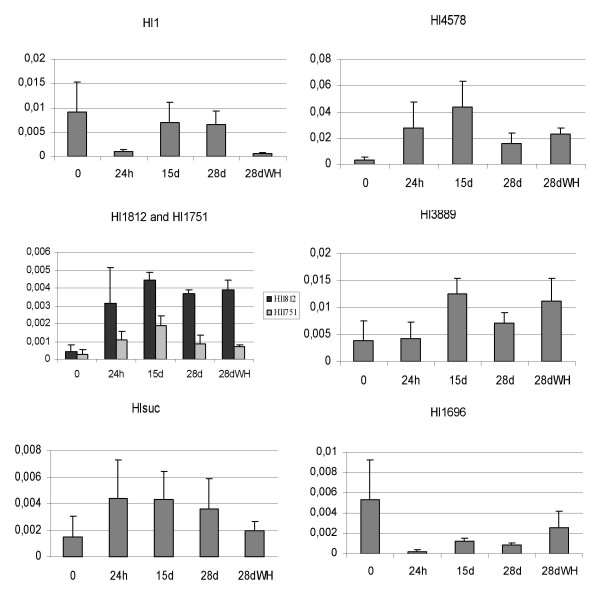
Figure 3.
Quantitative RT-PCR analysis. Complementary cDNAs were used encoding a metallothionein (Hl3889, Hlct1310), sucrose synthase (Hlsuc), glycolate oxidase (Hl1696), 3-deoxy-D-arabino-heptulosonate 7-phosphate synthase (Hl1812), cinnamic acid hydroxylase (Hl1751) and peroxidases (Hl1 and Hl4578). Hl1812 and Hl1751 are both involved in secondary metabolism and were grouped together. Values are the mean of three-four experiments; bars represent SE. Graphs are plotted against relative cDNA concentration (Y axis) assessed by plasmid.

