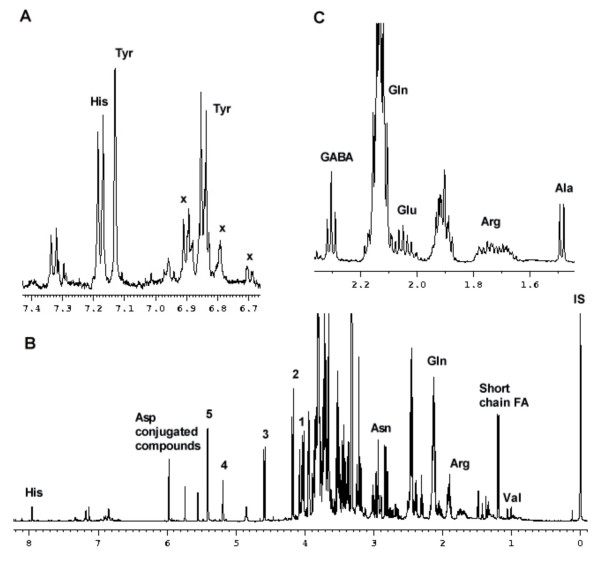
Figure 4.
1H NMR analysis in a sample corresponding to prenodular stage (T15d). A 1H NMR spectra corresponding to a T15d sample in the range of δ 6.66 to δ 7.43. X, dihydrophenylpropanoids. B 1H NMR spectra corresponding to a T15d sample in the range of δ 0–8.2. 1, myo-inositol; 2, H-1 of Fru in Suc; 3 H-1 of β-Glc; 4, H-1 of α-Glc; 5, H-1 of Suc; IS, internal standard (TSP); FA, fatty acid.C Expansion in the range of δ 1.43 to δ 2.38. Peak of Gln was partially deleted.

