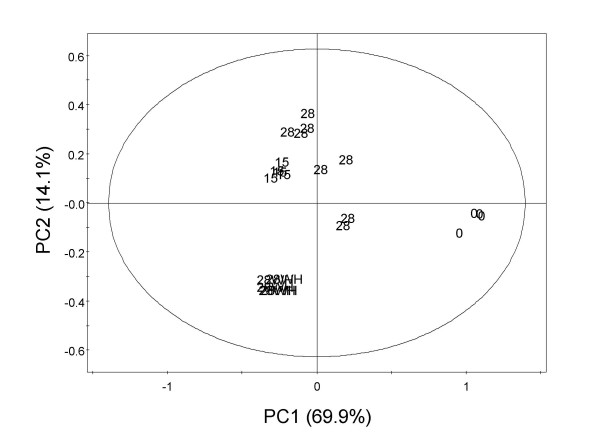
Figure 6.
Score scatter plot discriminating morphogenic stages by using metabolic profiling coupled to principal component analysis. Spectral intensities were scaled to total intensity and reduced to integrated regions of equal width (0.04 ppm). The ellipse represents the Hotelling T2 with 95% confidence in score plots.

