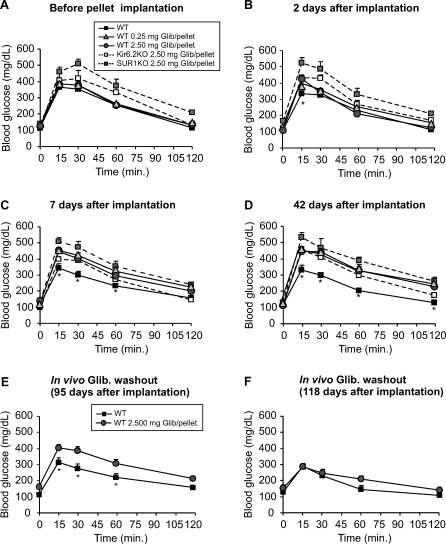
Figure 2. Impaired Glucose Tolerance in Mice Implanted with High Dose Slow-Release Glibenclamide Pellets.
GTTs on WT mice before (A), 2 d (B), 7 d (C), 42 d (D), 95 d (E), and 118 d (F) after implantation of pellets containing high doses of glibenclamide. Each group contained ten mice, except five in (E) and (F). Mice were injected intraperitoneally with glucose (1.5 g/kg). Blood was taken at times indicated and assayed for glucose concentration. In each graph, asterisks indicate control group is significantly different (p < 0.05) from the test group at the specified time point.

