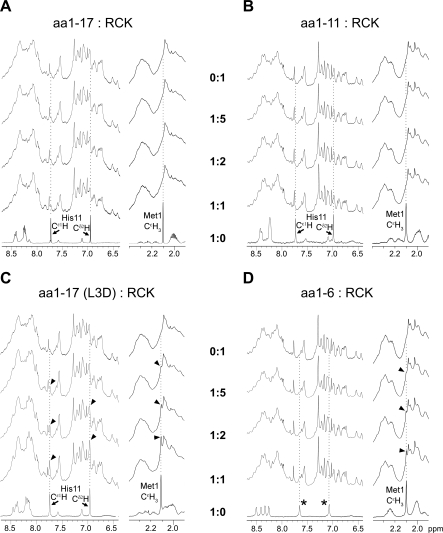
Figure 4. The 700-MHz 1H NMR Spectra of Isolated RCK Domain Titration by Synthetic Peptides.
The regions of 8.7…6.4 ppm and 2.4…1.9 ppm of the spectra are shown. The spectrum of the RCK domain without peptide is shown in the top rows; spectra of free peptides are shown in the bottom rows. Characteristic peaks are traced with the dotted lines.
(A and B) Isolated RCK protein titrated with aa1–17 and aa1–11 peptides. The three characteristic peaks of the peptides disappeared when mixed with the RCK protein.
(C and D) Isolated RCK protein titrated with the mutant aa1–17(L3D) and aa1–6 peptides. The characteristic peptide peaks are clearly detected in the peptide-RCK mixtures (arrowheads). Asterisks indicate peaks from the protons of the C-terminal amide group.

