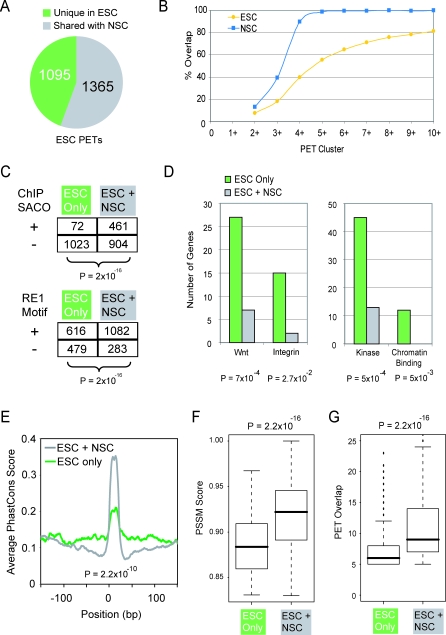
Figure 4. ESC-Specific Gene Targeting by REST.
(A) ESC-specific REST binding sites (green) are defined as those loci having PET10+ in ESC and no evidence (PET1 or no PET) in NSC.
(B) For ESC (yellow) or NSC (blue), the fraction of PET clusters of a given size range that also overlap a PET5+ cluster from the other cell type is plotted.
(C) The numbers of ESC-specific and common REST PETs shared with kidney cells (from ChIP-SACO [22]), and the numbers overlapping full-length RE1 motifs are shown. Statistical significance was calculated using the Chi-squared test.
(D) Genes involved in Wnt and integrin signaling, and genes encoding kinases and chromatin-binding proteins are enriched amongst targets of ESC-specific REST PET clusters. Shown are the numbers of genes and p-value (Chi-square test) for each ontology term among annotated targets of the PET clusters from (A).
(E) ESC-specific and ESC-NSC common binding sites have distinct sequence conservation. All REST PET clusters with an identifiable, consensus RE1 were aligned in the same strand orientation. The mean PhastCons sequence conservation score [54] for every position in a 300-bp window around the RE1 is plotted. Statistical significance is based on comparing the mean Phastcons score across every 21mer RE1 (Student's t-test).
(F and G) Boxplots show the distribution of (F) RE1 PSSM scores [18] and (G) PET overlap count for ESC-only and common ESC-NSC PET clusters. Statistical significance was calculated using Student's t-test.

