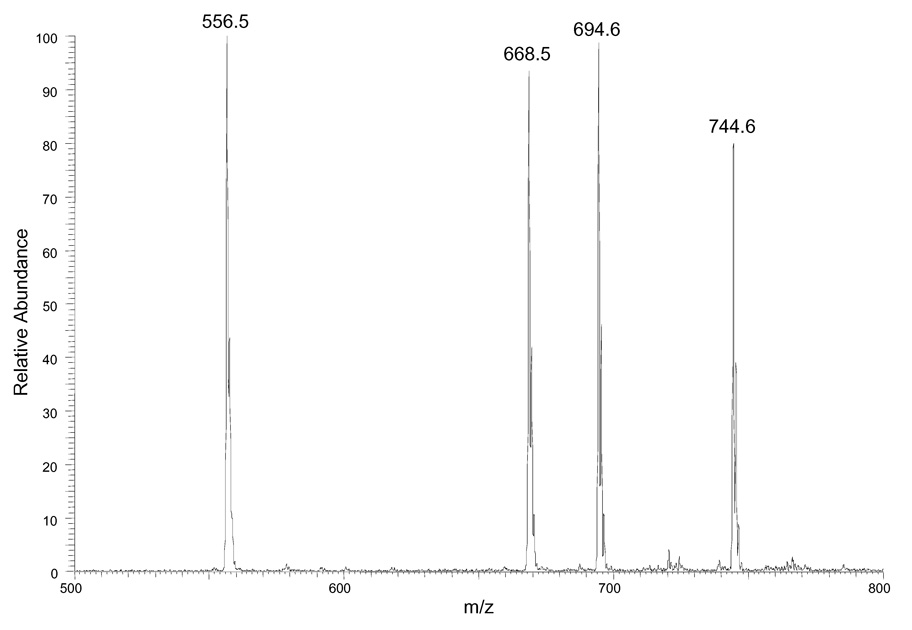
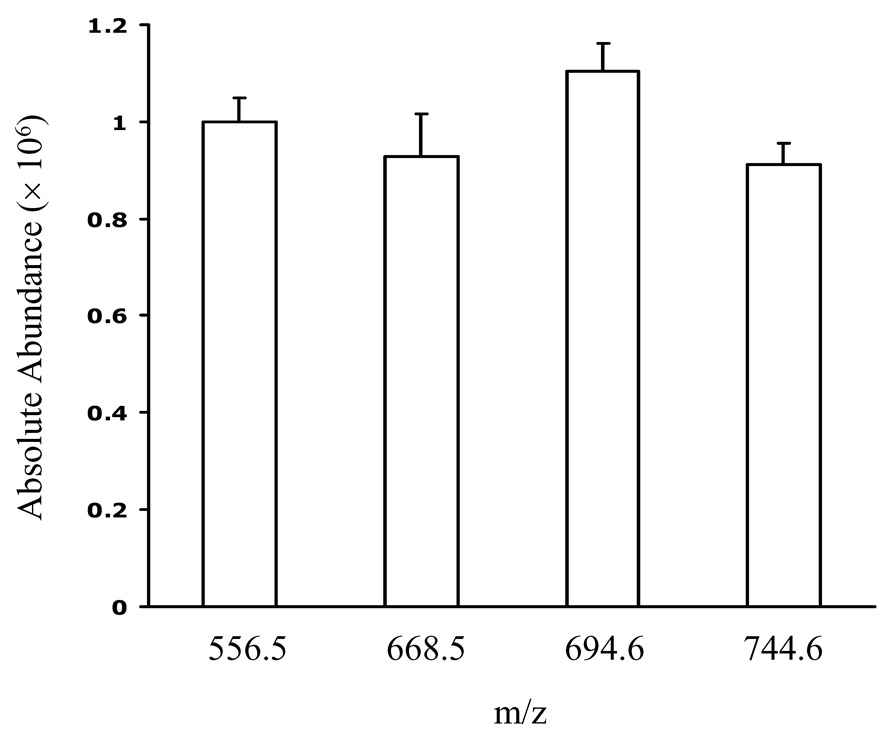
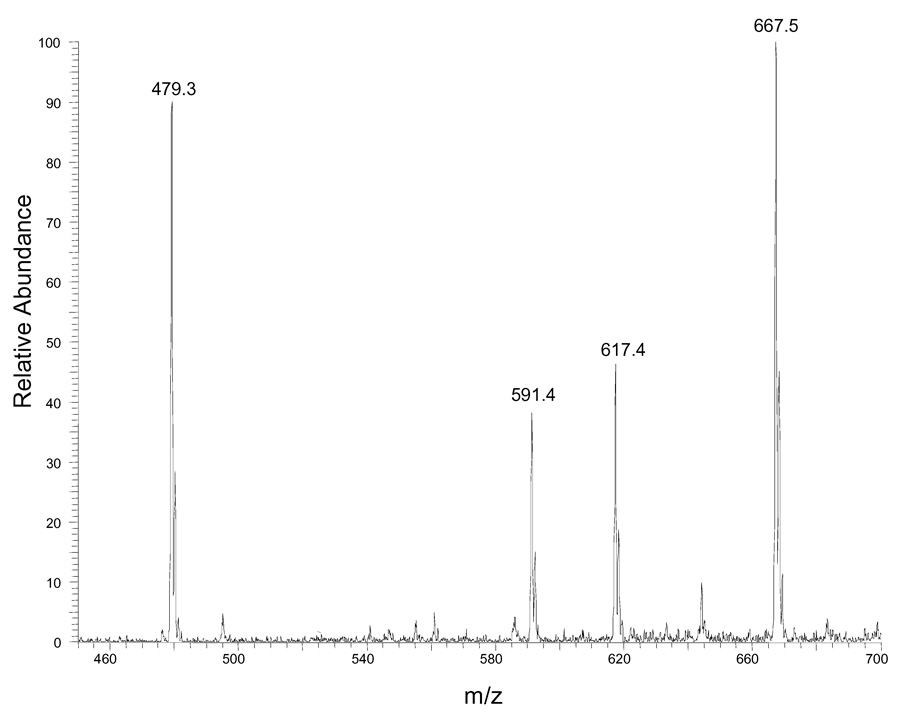
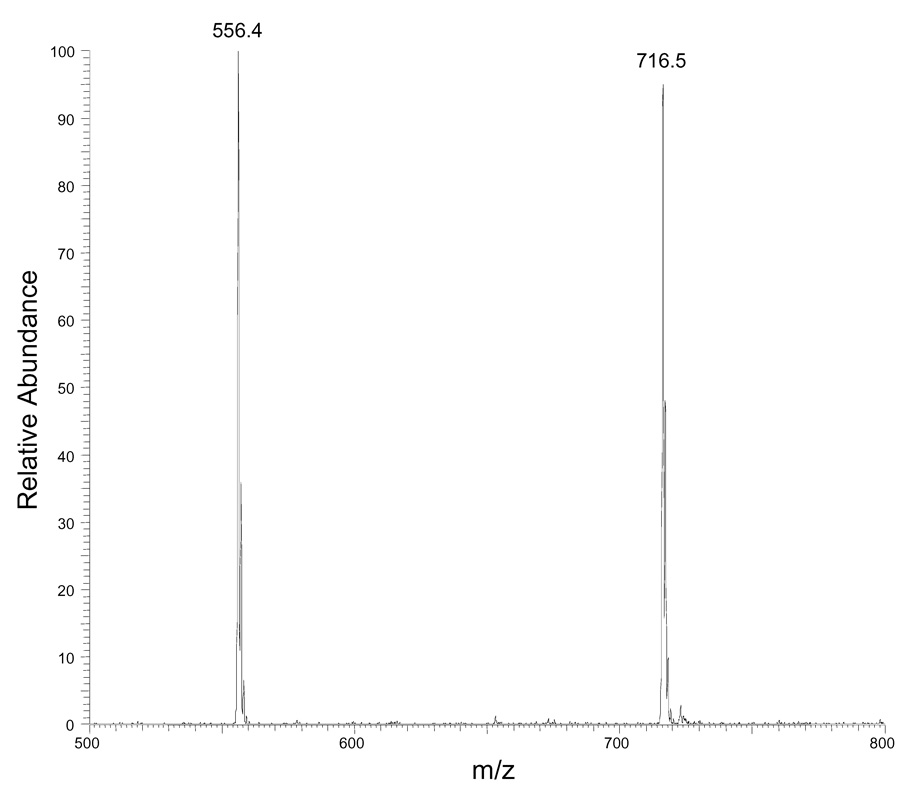
Figure 1.
(A) ESI mass spectrum of equimolar mixtures of four DAG species (12:0/12:0, 16:0/16:0, 16:0/18:1, 18:0/20:4) after derivatization. (B) Signal intensities of four DAG standards after correcting for the variable 13C content of each analyte. The error bar shows the relative standard deviation (RSD) of each measurement (N = 3 for each point). (C) ESI mass spectrum of equimolar mixtures of four DAG species (12:0/12:0, 16:0/16:0, 16:0/18:1, 18:0/20:4) without derivatiozation. (D) ESI mass spectrum of equimolar mixtures of 1,2-DAG (12:0/12:0) and 1,3-DAG (18:2/18:2) after derivatization.


