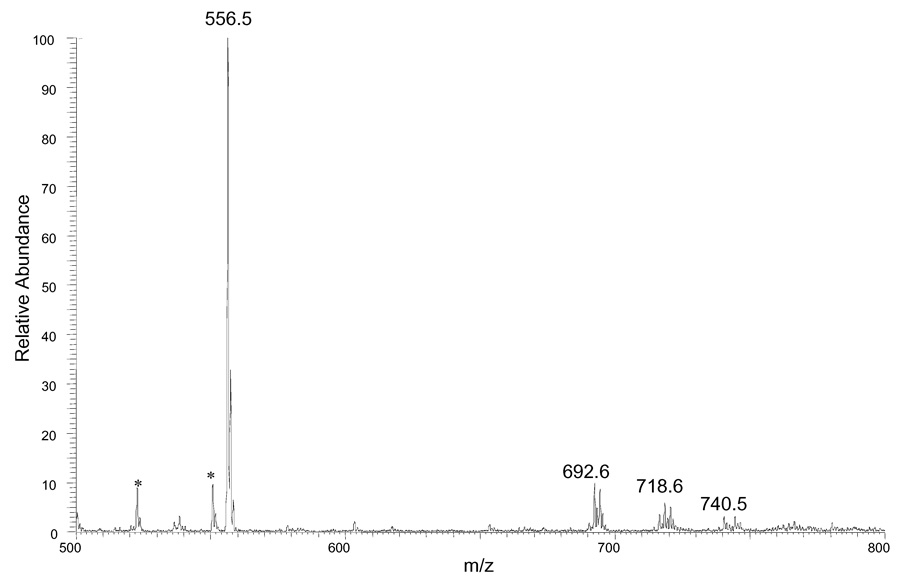
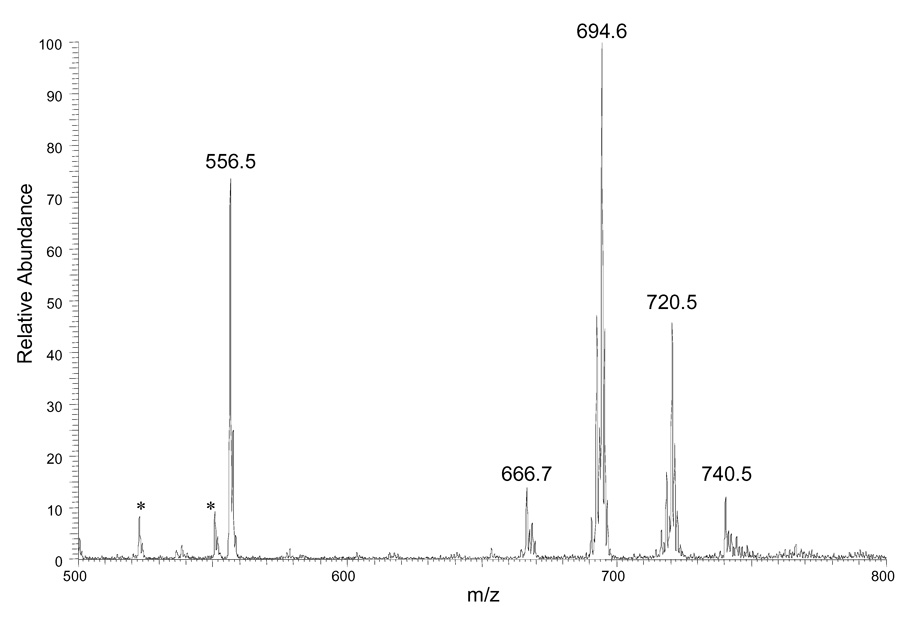
Figure 4.
ESI mass spectra of derivatized DAG mixtures from (A) lean mouse livers (B) obese mouse livers. An identical amount of the DAG standard (12:0/12:0) (1 nmol/mg wet weight) was added to both tissue samples before the derivatization step to serve as internal standard. Unidentified peaks are labeled with a star.


