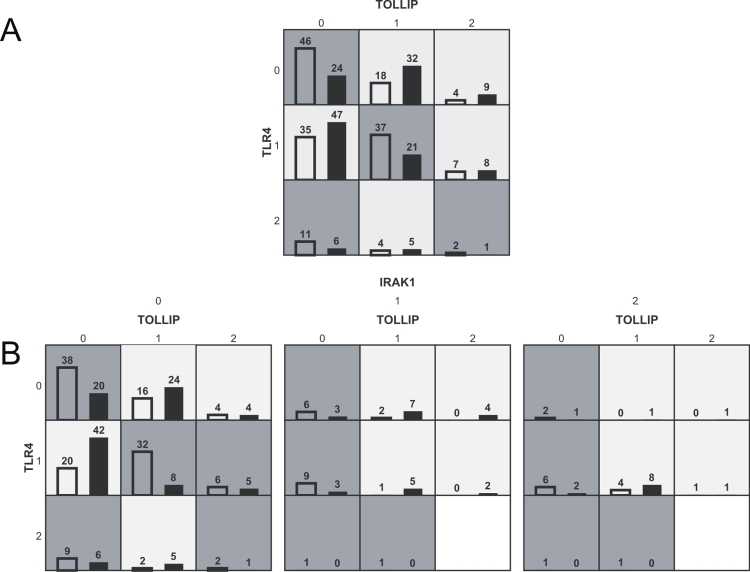
Figure 2. Genetic interactions between TOLLIP, TLR4, and IRAK1.
Graphical display of evidence observed in MDR analysis of interaction among SNPs in TOLLIP (rs4963060), TLR4 (rs6478317) and IRAK1 (rs1059703). For each cell the left bar (empty) represents the number of children with PT-IgG in the highest 33rd percentile (total: 164) and the right bar (dark) the number of children with PT-IgG in the lowest 33rd percentile (total: 153) for the specific combination of 2 (fig 2A) or 3 genotypes (fig 2B). When the ratio is >164/153 the cell indicates a higher chance on a titer in the highest 33rd percentile (dark background), and when the ratio is <164/153 the cell indicates a higher chance on a titer in the lowest 33rd percentile (light background). 0, 1, and 2 represent the number of minor alleles.

