Figure 1.
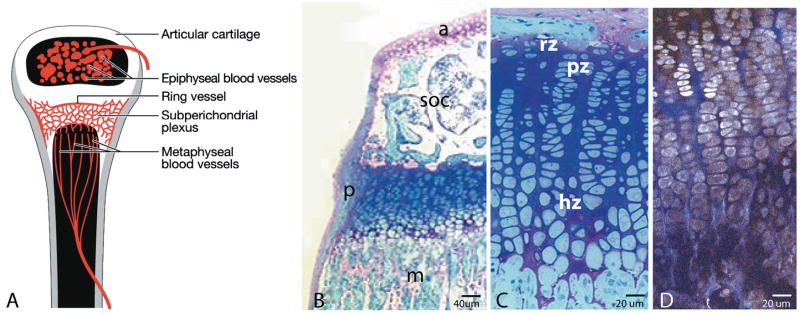
Figure 1A depicts the proximal tibia in a young mouse showing the three potential routes of vascular access to the growth plate: vessels of the epiphysis, vessels of the metaphysis, and vessels associated with a ring vessel and plexus running just deep to the periosteum. The latter vessels would not be visible on a sagittal section, since they are associated with the periosteum. Figure 1B is a one-micron-thick histological section of the proximal tibia from a four-week-old mouse, fixed in 2% paraformaldehyde/ 2% glutaraldehyde with 0.7% ruthenium hexamine trichloride, embedded in Epon-Araldite (Hunziker and Schenck, 1989), and stained with methylene blue/azure II/basic fuchsin. Note the articular cartilage (a), trabecular bone of the secondary center of ossification (soc), the perichondrium (p), and the longitudinally oriented bone of the elongating metaphysis (m). As shown in C, the reserve cell zone (rz) is limited to one or two cells adjacent to the secondary center. Proliferative zone cells (pz) are arranged in columns with their long axis perpendicular to the direction of growth; hypertrophic zone cells (hz) have their long axis parallel to the direction of elongation. Figure 1D is a multiphoton image of a sagittally sectioned, freshly isolated growth plate, non-stained, showing the same cellular morphology. Cellular autofluorescence (grey pseudocolor) and collagen second harmonic generation (blue pseudocolor) can be seen when the section is illuminated at 770 nm.

