Figure 3.
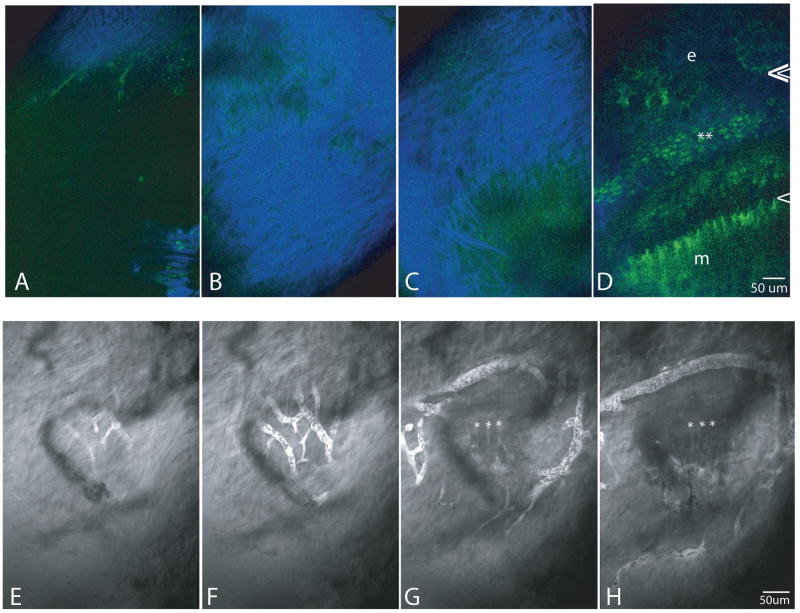
Figures A-D are four frames of a z-series, from superficial to the periosteum (A), through the periosteum (B,C), and to the growth plate (D) to verify orientation and positioning. Separation of emission colors allows simultaneous imaging of collagen second harmonic generation (blue), and OTC and GFP-fluorescence (green). GFP-positive proliferative cells are adjacent to the asterisks. OTC-fluorescent epiphyseal and metaphyseal COJs are indicated by double and single arrowheads respectively. The growth plate as imaged in Figure D is 70μm deep to the perichondrium. e=epiphyseal bone; m=metaphyseal bone
Figures 3. E-H demonstrate the network of the vascular plexus, visualized after an IP injection of fluorescein so that the plasma is fluorescent and blood cells can be seen as dark shadows within the vessels. Frames E and F (taken 5 μm deeper than E), demonstrate that the network of the plexus is on the deep side of the collagen of the perichondrium, and that the ring vessel is in a plane slightly deeper than the plexus. In frames G (another 20 μm deeper) and H (another 10 μm deeper) asterisks are positioned at the metaphyseal COJ. The ring vessel encircles the growth plate at approximately the P/H junction, and the plexus extends entirely on the hypertrophic zone side.

