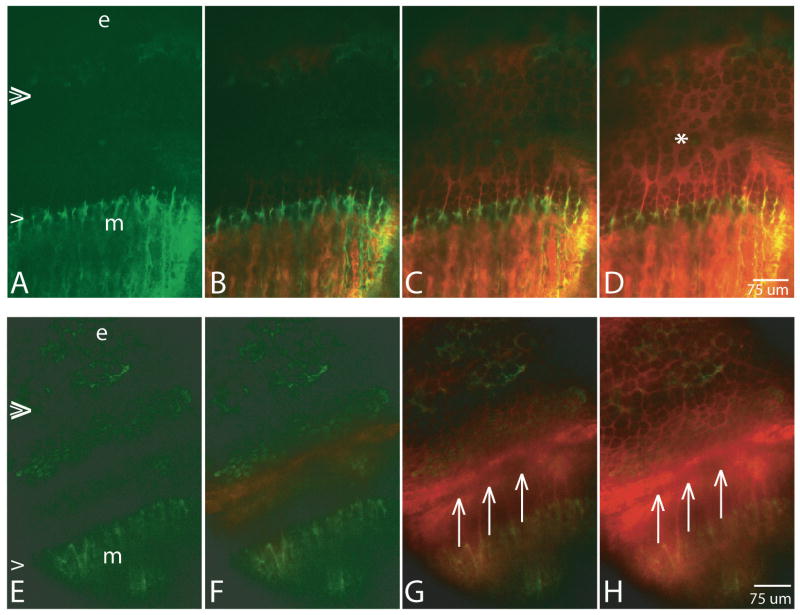
Figure 4.
Each row shows four frames from a timed series after injection of fluorescein (vascular concentration ∼2 mM), IP, pseudo-colored in red. The pattern of arrival of fluorescein into the growth plate reflects the depth of the imaging plane relative to ring vessel and plexus, more superficial in frames E-H than in frames A-D. The epiphyseal COJ is indicated by double arrowheads at the left in A and E, the metaphyseal COJ by a single arrowhead, and OTC-labeling of the bone is green. e=epiphyseal bone; m=metaphsyeal bone. In series A-D from a GFP-/- mouse, fluorescein arrives essentially simultaneously into the growth plate from both the epiphyseal and the metaphyseal sides (C, D are 336 and 590 seconds after injection, respectively), and the last area of the growth plate to be reached is the P/H junction (asterisk). By contrast, in a more superficial focal plane shown in E-H from a GFP +/- mouse, the P/H junction is the first region to receive fluorescein (F and continuing into G and H). Times after injection for F,G,H are 94, 242, and 401 seconds, respectively. The shadow indicated by three arrows in G and H is that of the ring vessel, with intense fluorescein on either side.

