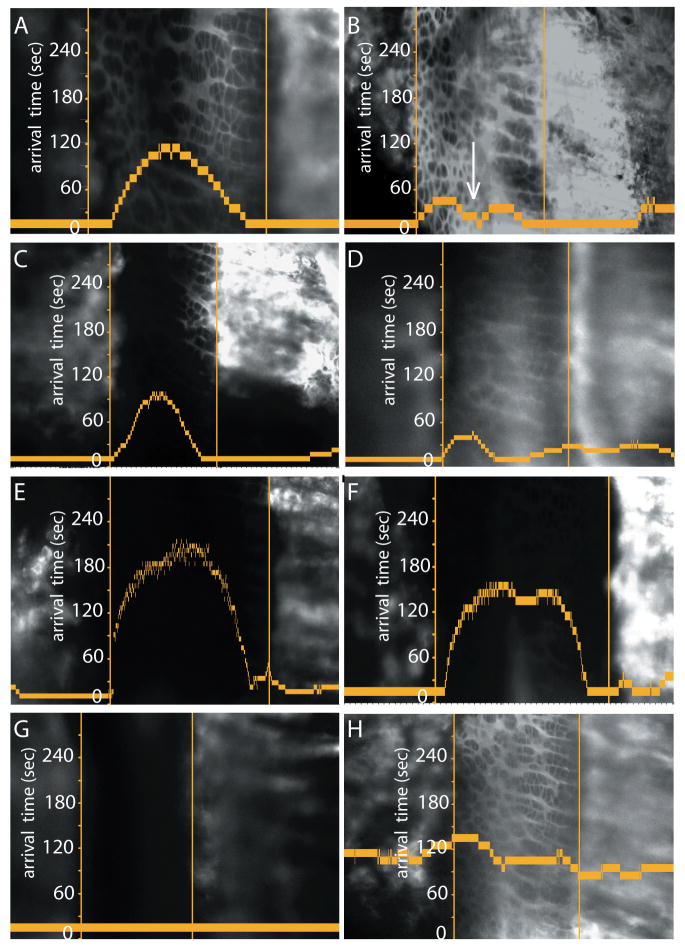
Figure 5.
Graphs show tracer arrival half-time (vertical axis) relative to the tracer's position-specific fluorescence at five minutes. The epiphyseal bone is on the left and the metaphyseal bone on the right, with the respective COJs represented as vertical lines. Figures A,B plot the entrance of fluorescein (∼2 mM vascular concentration), in a relatively deep (A, 90 μm deep to the periosteum) versus a relatively superficial (B, 45 μm deep to the periosteum) position. In the deep location (A), tracer arrives first from both COJ vasculatures, whereas in the superficial position arrival occurs just as early at the P/H junction, presumably from the ring vessel and plexus (arrow in B). Figures C,D and E,F are analogous graphs for the entrance of 3 kDa and 10 kDa dextrans, respectively, after IC injection of 50μl, 0.1% solution. Patterns of arrival are identical to those for fluorescein. Figure G demonstrates that the 40 kDa dextran, injected IC, does not enter the growth plate. Figure H demonstrates an IP injection of fluorescein (200μl, 0.5% solution) in a superficial position. The form of the graph indicates the arrival of fluorescein to the growth plate is significantly slower than when injected IC (B), and also that in this image plane a significant amount is reaching the hypertrophic zone from the plexus, indicated by the relatively long straight line in the graph covering most of the hypertrophic cell zone.

