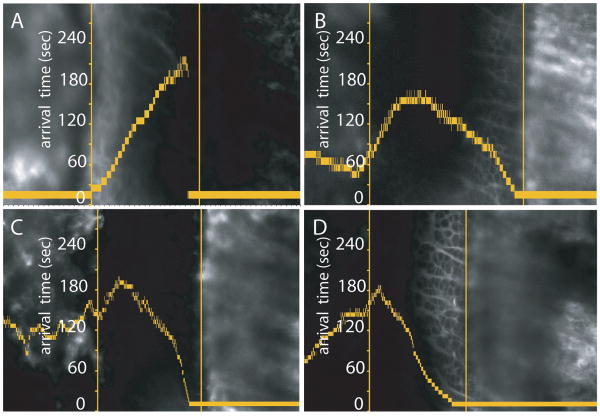
Figure 7.
These graphs are presented with the same conventions as Figure 5. Figures A,B demonstrate that IC-injected fluorescein (50μl, 1% solution) can enter entirely from the epiphyseal vasculature (A), or almost entirely from the metaphyseal vasculature (B), if the experimental situation is such that the vasculature of one side of the growth plate fills more rapidly than that of the other. In this situation, the fluorescein that enters has the potential to move throughout the growth plate, reaching the opposite COJ (7A). Figure 7C demonstrates that dextrans also behave this way. The specific graph demonstrates entrance of a 10 kDa dextran, primarily from the metaphyseal side and diffusing from the metaphyseal COJ well into the proliferative cell zone. Figure 7D is an IC injection of fluorescein, following the 10 kDa injection, demonstrating that directionality of entrance of fluorescein mirrors that of the 10 kDa dextran.

