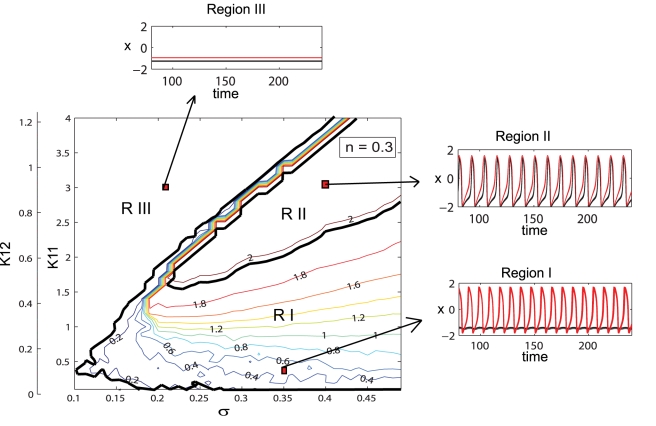
Figure 2. Dynamical regimes of a dominantly excitatory neural population.
Contour map of the mean field amplitude calculated for the ratio n = 0.3 and mean m = 0 are displayed as function of connectivity strengths K 11, K 12 and strength of dispersion σ. Three different regions with specific oscillatory behavior are identified. Examples of time series for neurons with low (black) and high (red) value of the I parameter are given.

