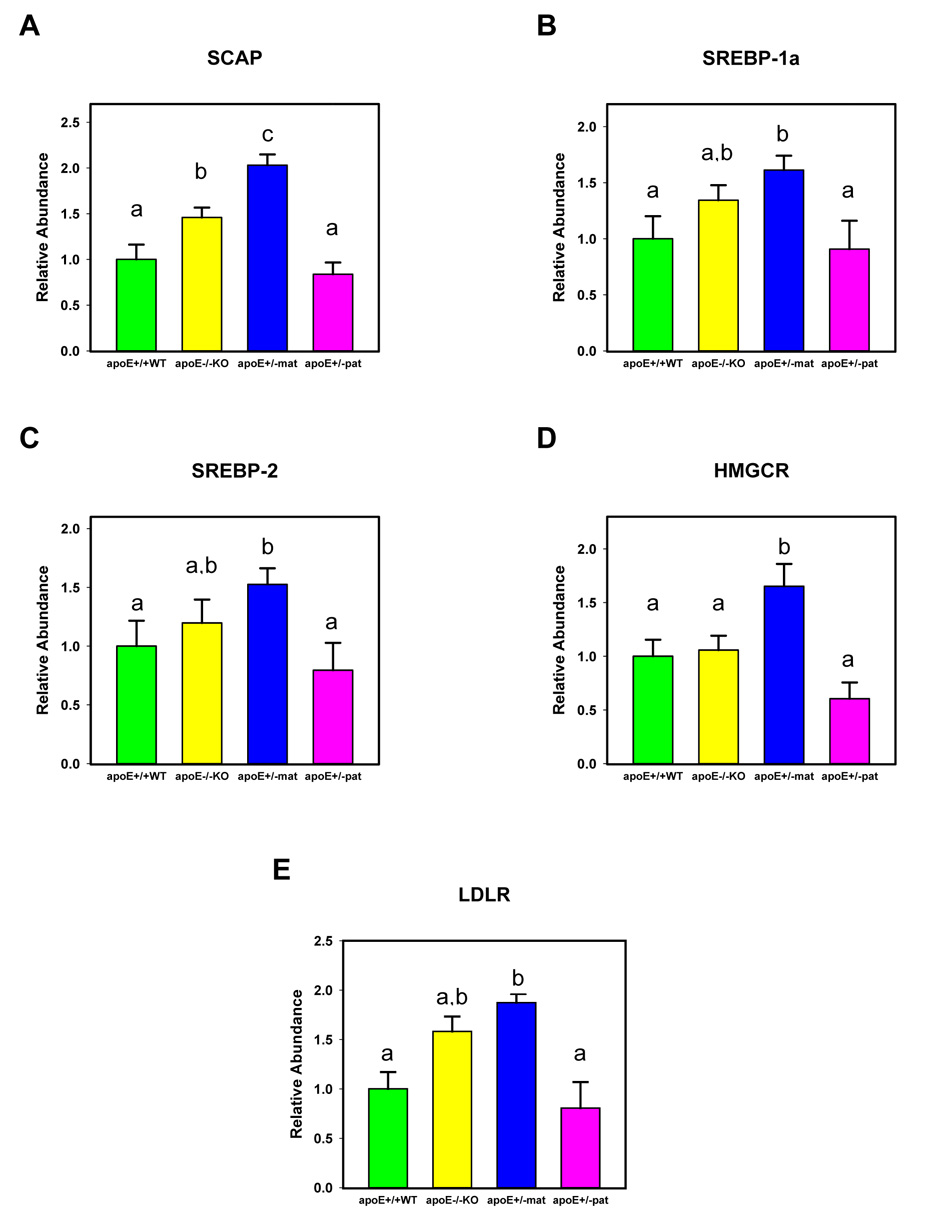
Figure 2.
Mean relative mRNA expression levels and standard errors for SCAP (A), SREBP-1a (B), SREBP-2 (C), HMGCR (D) and LDLR (E) by study group. Labeling of columns by different letters denotes a significant difference (p<0.05) between the means in post-hoc analysis. The significance levels specifically are as follows: (A) SCAP (p<0.0001 by ANOVA): p<0.0001 for apoE+/−mat vs. apoE+/+WT, p<0.0001 for apoE+/−mat vs. apoE+/−pat, p=0.0088 for apoE+/−mat vs. apoE−/−KO; (B) SREBP-1a (p<0.0001 by ANOVA): p<0.0001 for apoE+/−mat vs. apoE+/+WT, p=0.0027 for apoE+/−mat vs. apoE+/− pat; (C) SREBP-2 (p=0.0016 by ANOVA): p=0.0004 for apoE+/−mat vs. apoE+/+WT, p=0.0046 for apoE+/−mat vs. apoE+/−pat; (D) HMGCR (p=0.0109 by ANOVA): p=0.0082 for apoE+/−mat vs. apoE+/+WT , p=0.0042 for apoE+/−mat vs. apoE+/−pat; (E) LDLR (p=0.002 by ANOVA): p=0.03 for apoE+/−mat vs. apoE+/+WT.

