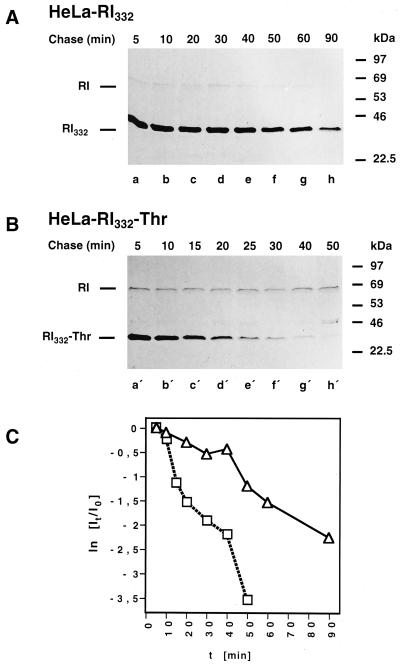
Figure 2.
Kinetics of degradation of RI332 and RI332-Thr expressed in HeLa cells. HeLa-RI332 (A) and HeLa-RI332-Thr (B) cells were pulse labeled for 10 min and chased for up to 90 or 50 min, respectively. The cells were lysed, and anti-ribophorin I immunoprecipitations were performed. All samples were analyzed by SDS-PAGE followed by fluorography. (C) Quantitations of the bands corresponding to radiolabeled full-length (RI) and truncated ribophorin I variants were obtained by scanning densitometry. Semilog plots showing the degradation kinetics of RI332 (▵) and RI332-Thr (□) were established as described in MATERIALS AND METHODS. Data from three independent experiments are shown.

