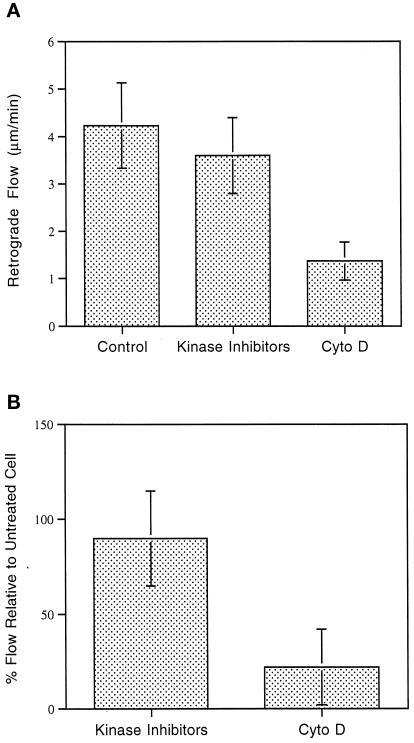
Figure 9.
(A) Retrograde flow rate of control cells and cells treated with kinase inhibitors, as well as retrograde retraction of the central cytoskeleton in cells treated with cytochalasin D. Note that the flow rate in control cells is not statistically significantly different from the rate exhibited at the periphery of kinase inhibitor-treated cells; however, it is significantly greater than the cytochalasin D retraction rate (p = 0.01). (B) Percent flow in cells treated with kinase inhibitors or cytochalasin D relative to the flow rate in the same cell before treatment.

