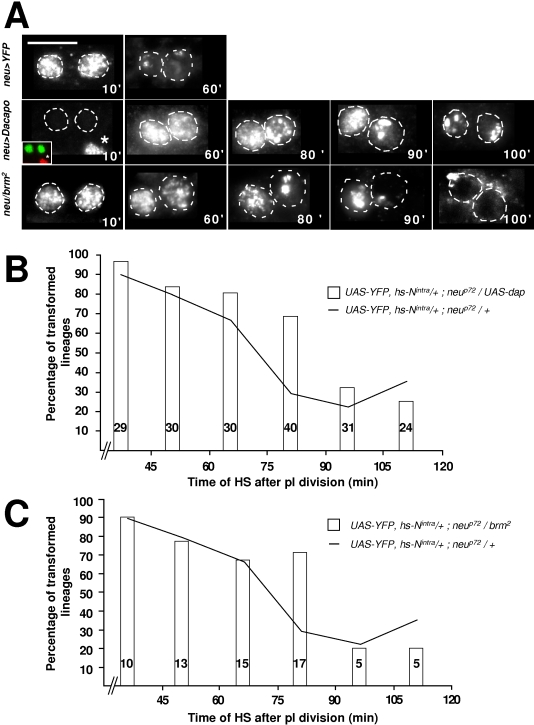
Figure 5. The timing of the response to Notch is correlated with the S-phase.
(A) The duration of the S-phase was monitored by combining time-lapse imaging and BrdU incorporation. The age of clusters after pI division is indicated at the bottom right of each frame (in min). Anterior is on the left. Note that Dacapo overexpression shifted the S-phase while, in brm2 heterozygous flies, the S-phase was lengthened. The inset in the 10' frame in Dap overexpression images shows BrdU incorporation (in red) in epithelial cells (asterisk) while there is no incorporation in the secondary precursor cells (in green). Scale bar: 5 µm. (B–C) Histograms show the percentage of transformed sensory organs (resulting from the formation of two pIIa cells) as a function of the moment of N activation (abscissa) in a Dap overexpression background (B) and in a brm2 heterozygous background (C). Control data (hs-Nintra pupae alone) were collected throughout all experiments. Since we never saw any significant differences in these data, they were pooled and are presented in (C) and (D) as a continuous line. Note that in both cases the transformation was significantly higher when a Nintra pulse was applied between 75 and 90 min after pI division.

