
Fig. 5.
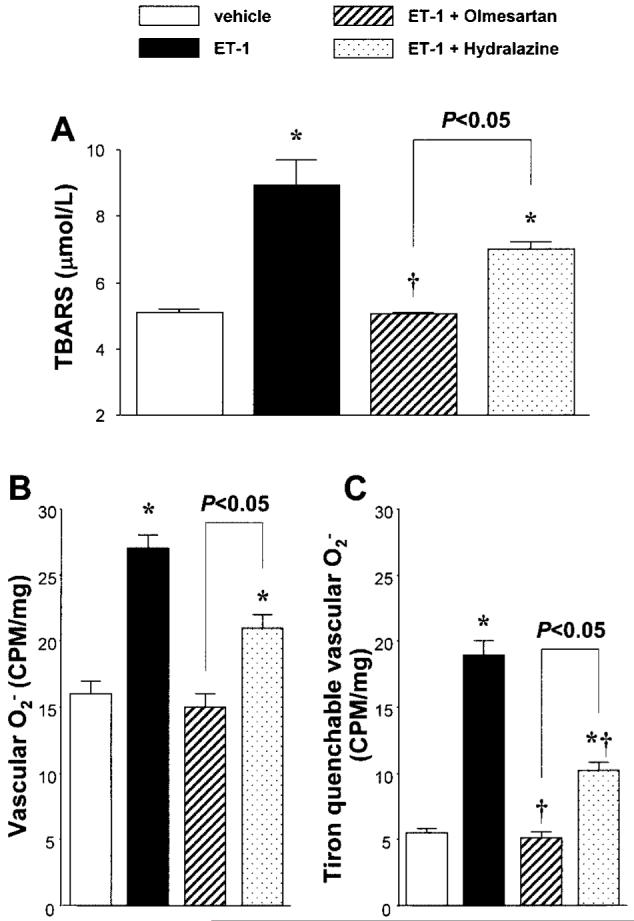
A: Plasma thiobarbituric acid-reactive substance (TBARS) levels. B: Vascular superoxide anion (O2-) production assessed by lucigenin chemiluminescence in aortic segments. C: The differences between the values obtained before and after Tiron (20 mmol/l) addition were calculated and defined as the Tiron-quenchable lucigenin chemiluminescence. Lucigenin chemiluminescence was expressed as counts per minute (CPM) per milligram of dry tissue weight. *p<0.05 vs. vehicle-infused rats. †p<0.05: endothelin (ET)-1-infused rats vs. ET-1-infused rats+olmesartan or hydralazine.