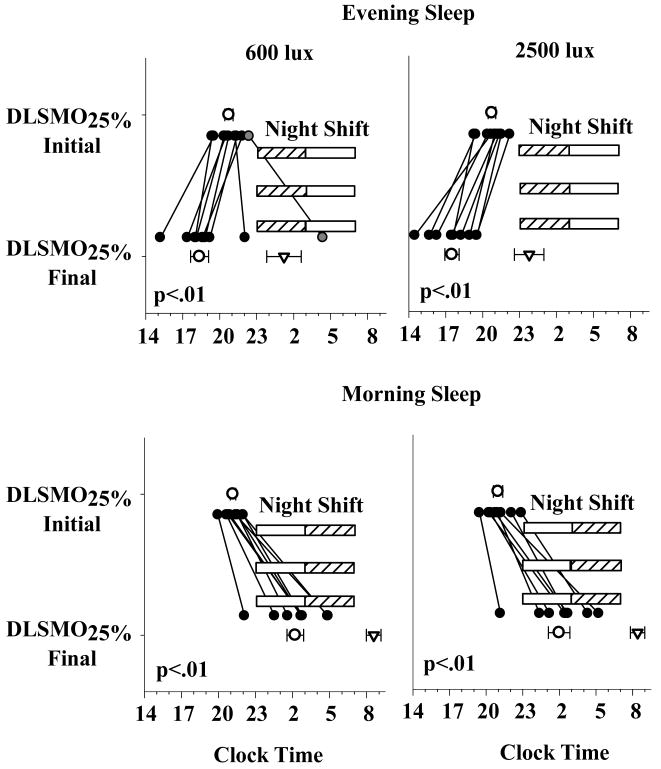
Figure 2. DLSMO25% in the Evening and Morning Sleep groups.
These data represent the individual DLSMO25% (filled circles), and average (mean ± SEM) DLSMO25% (open circles) and average CBTmin (inverted triangles) for the four sleep × light intensity groups. The x-axis represents clock time and the y-axis represents the endogenous circadian phase assessments. The horizontal hashed bars represent the night shifts and the open bars the timing of the Light Exposure respectively. In the Evening Sleep group, 7 out of 8 subjects in the 600 lux condition and all subjects in the 2500 lux (n = 8) condition exhibited a phase advance in DLSMO25%. One subject (gray circle, top left panel) in the Evening Sleep, 600 lux condition exhibited 4:18 h phase delay and another a 12 minute phase delay. In the Morning Sleep group, all subjects in the 600 lux (n = 9) and 2500 lux (n = 8) conditions exhibited a phase delay. CBTmin in the Evening Sleep subjects (600 lux: 1:13 ± 1:12 h; 2500 lux: 23:46 ± 1:02 h) was phase advanced relative to the Morning Sleep subjects (600 lux: 8:43 ± 0:59 h; 2500 lux: 8:24 ± 0:59 h).

