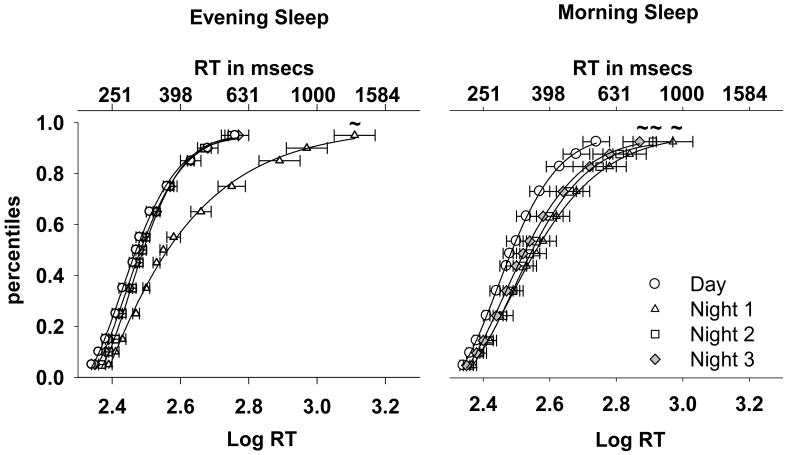
Figure 3. PVT Cumulative Response Time Distribution.
The data represent the average RT percentiles (Mean ± SEM; symbols) and the fitted CDF (4-parameter Weibull) for the four work shifts. The data for each sleep group (Morning Sleep: n = 17; Evening Sleep: n = 16) is averaged over the light exposure conditions. The PVT was administered every two hours starting at 0830 on the day shifts and at 0030 on the night shifts. The bottom x-axis represents Log transformed RT and the top x-axis the equivalent RT in milliseconds. The y-axis represents percentile points. A rightward shift along the x-axis corresponds to a lengthening of RT and a stretching of the tail of the distribution corresponds to an increase in long RT. The ‘∼’ represents a comparison with the day shift RT curve (F-test) at p = 0.05 level.

