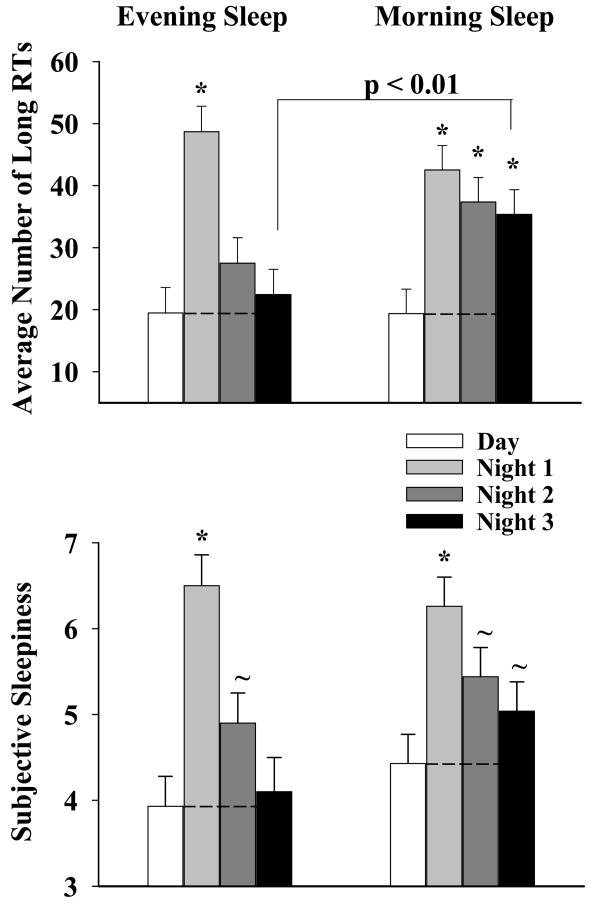
Figure 4. Episodes of Attentional Impairment and Subjective Alertness.
The top panel shows the number of long RTs (Mean ± SEM) per work shift for the two sleep groups (Morning Sleep: n = 17; Evening Sleep: n = 16) averaged over the light exposure conditions. The x-axis represents work shift and the y-axis represents the number of RT outliers. Increasing values reflect increasing attentional impairment.
The bottom panel shows the KSS scores (Mean ± SEM) per work shift for the two sleep groups (Morning Sleep: n = 17; Evening Sleep: n = 16) averaged over the light exposure conditions. The x-axis represents work shift and the y-axis represents the KSS score. Increasing values reflect deteriorating alertness. The KSS was administered every two hours starting at 0830 on the day shifts and at 0030 on the night shifts. The symbols ‘*’ and ‘∼’ represent a comparison to baseline sleep at the p < 0.01 and p < 0.05 level respectively (paired t-test).

