Figure 1.
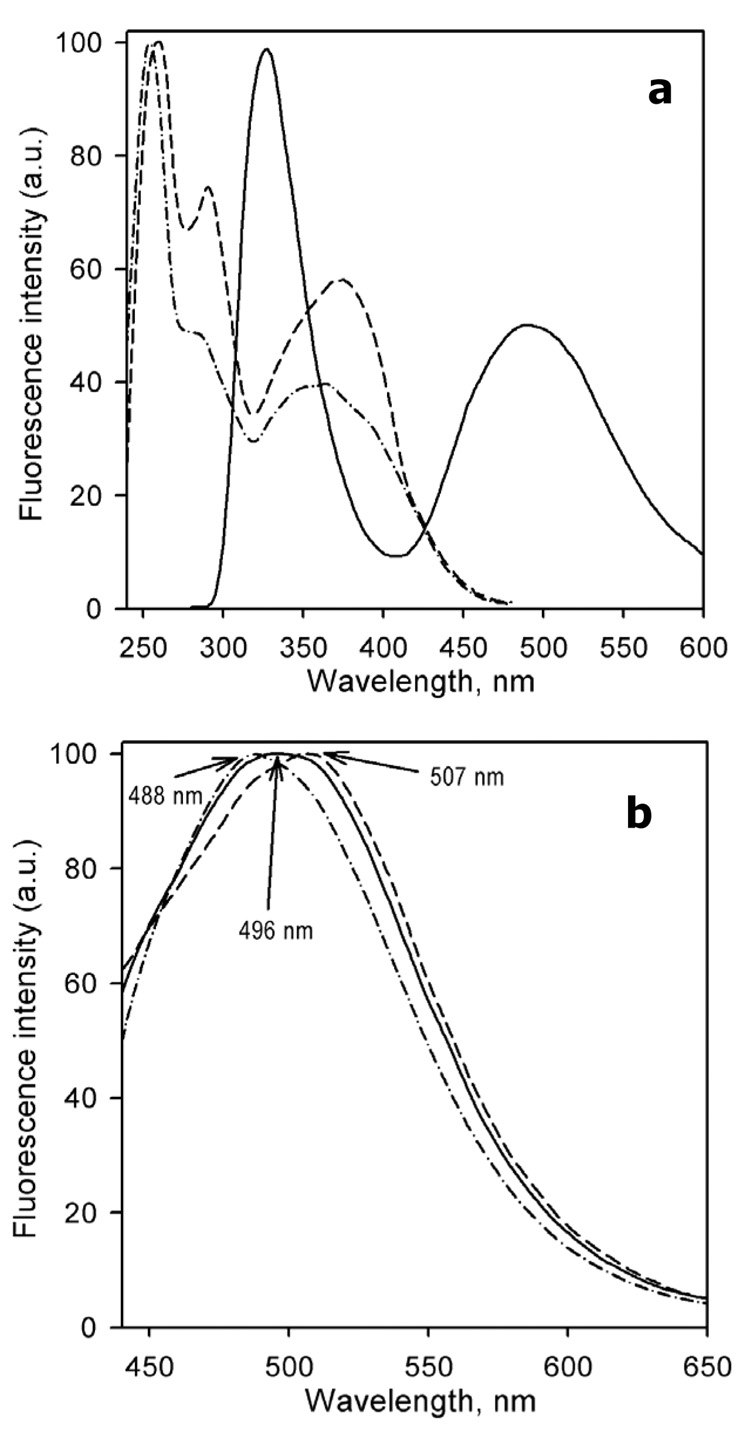
Spectra of fluorescence emission and excitation of CYP3A4(C58,C64)-BADAN (10 µM solution in 100 mM Na-Hepes puffer, pH 7.4, 1 mM EDTA, 1mM DTT). Panel a shows the spectra of emission (excitation at 260 nm, solid line) and excitation (emission at 490 nm, dashed line) The excitation spectrum of a gluthatione adduct of BADAN (emission at 490 nm) is shown for comparison by a dashed-and-dotted line. Panel b shows the spectra of emission of CYP3A4(C58,C64)-BADAN recorded with excitation at 280 nm (solid line), 315 nm (dashed line) and 385 nm (dashed-and-dotted line). All spectra were recorded at 25 °C in a 5×5 mm quartz cell with emission and excitation bandwidths of 2 nm. The spectra were corrected for the spectral response of the detector. The amplitudes of all spectra were normalized to fit into 0 – 100 units scale.

