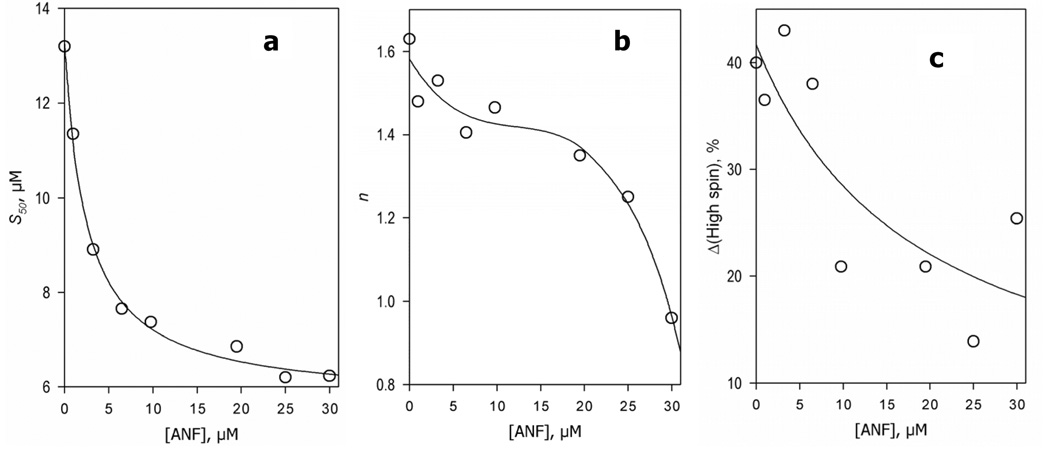
Figure 8.
Effect of increasing concentrations of ANF on the parameters of CYP3A4 interactions with 1-PB monitored by the substrate-induced spin shift. Each data point shown on the graphs represents an average of the results of 2–6 individual experiments. The typical confidence interval (p = 0.05) calculated for these estimates was about ± 20% of the respective values. Solid lines shown in panels a and c represent the results of the fitting of the data sets to the Michaelis-Menten equation (KM values of 2.5 µM and 18 µM, respectively). The line in panel b represents the fitting of the data set by a third-order polynomial. The curve is given solely to visualize the general trend of the points and has no conceptual meaning.

