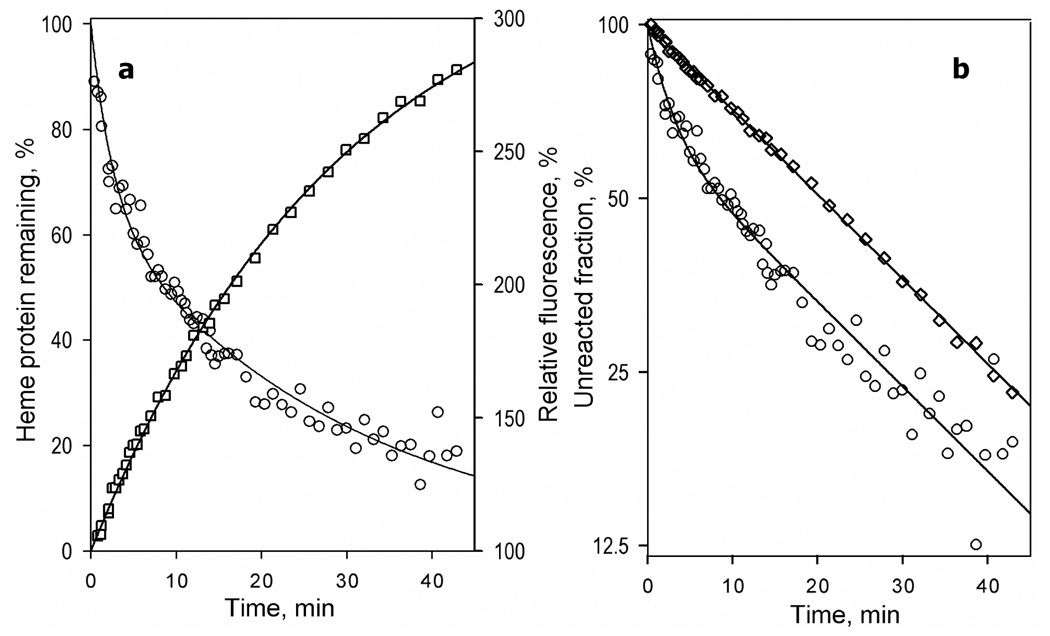
Figure 9.
Kinetics of H2O2-dependent heme depletion (circles) and the corresponding changes in the intensity of fluorescence of the label (squares) in CYP3A4(C58,C64)-CPM in linear (a) and semi-logarithmic (b) coordinates. Conditions: 1.5 µM CYP3A4(C58,C64)-CPM and 60 mM H2O2 in 0.1 M Na-HERES buffer, 1mM DTT, 1mM EDTA.

